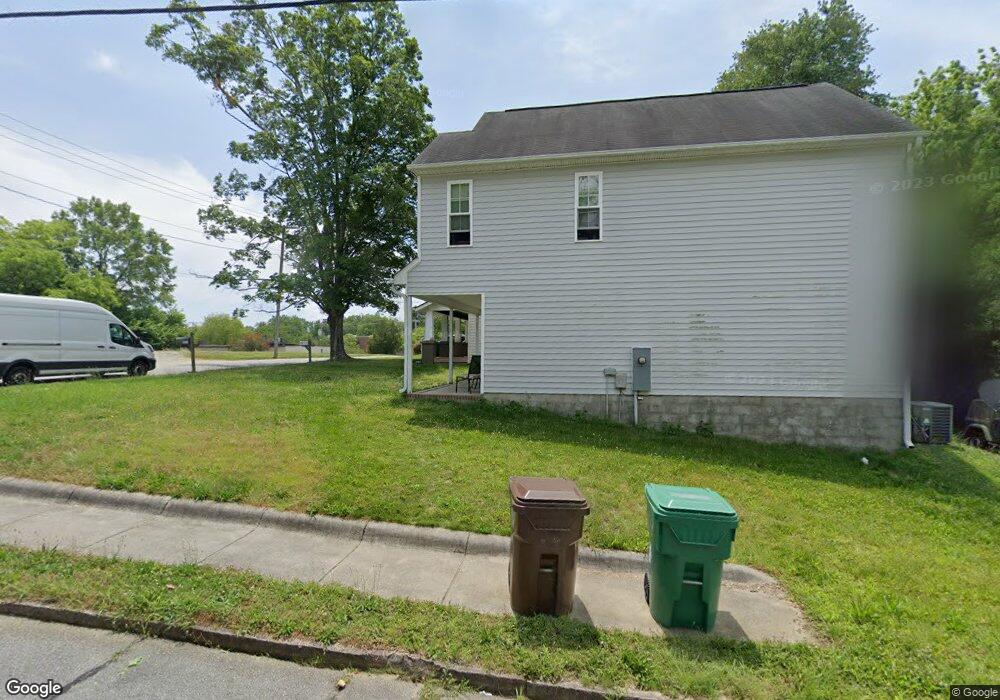
611 Delmont St High Point, NC 27262
Downtown High Point NeighborhoodEstimated Value: $182,590 - $228,000
Studio
--
Bath
1,418
Sq Ft
$141/Sq Ft
Est. Value
About This Home
This home is located at 611 Delmont St, High Point, NC 27262 and is currently estimated at $199,398, approximately $140 per square foot. 611 Delmont St is a home with nearby schools including Northwood Elementary School, Ferndale Middle School, and High Point Central High School.
Ownership History
Date
Name
Owned For
Owner Type
Purchase Details
Closed on
Nov 18, 2020
Sold by
Hensley Investment Properties Inc
Bought by
Chavis Stephany L
Current Estimated Value
Home Financials for this Owner
Home Financials are based on the most recent Mortgage that was taken out on this home.
Original Mortgage
$120,000
Outstanding Balance
$96,827
Interest Rate
2.8%
Mortgage Type
New Conventional
Estimated Equity
$102,571
Purchase Details
Closed on
Apr 15, 2011
Sold by
Davis James A and Davis Candance A
Bought by
Hensley Investment Properties Inc
Home Financials for this Owner
Home Financials are based on the most recent Mortgage that was taken out on this home.
Original Mortgage
$67,000
Interest Rate
4.83%
Mortgage Type
Construction
Create a Home Valuation Report for This Property
The Home Valuation Report is an in-depth analysis detailing your home's value as well as a comparison with similar homes in the area
Home Values in the Area
Average Home Value in this Area
Purchase History
| Date | Buyer | Sale Price | Title Company |
|---|---|---|---|
| Chavis Stephany L | $120,000 | None Available | |
| Hensley Investment Properties Inc | $14,000 | None Available |
Source: Public Records
Mortgage History
| Date | Status | Borrower | Loan Amount |
|---|---|---|---|
| Open | Chavis Stephany L | $120,000 | |
| Previous Owner | Hensley Investment Properties Inc | $67,000 |
Source: Public Records
Tax History
| Year | Tax Paid | Tax Assessment Tax Assessment Total Assessment is a certain percentage of the fair market value that is determined by local assessors to be the total taxable value of land and additions on the property. | Land | Improvement |
|---|---|---|---|---|
| 2025 | $1,674 | $121,500 | $30,000 | $91,500 |
| 2024 | $1,674 | $121,500 | $30,000 | $91,500 |
| 2023 | $1,674 | $121,500 | $30,000 | $91,500 |
| 2022 | $1,638 | $121,500 | $30,000 | $91,500 |
| 2021 | $1,596 | $115,800 | $25,000 | $90,800 |
| 2020 | $1,596 | $115,800 | $25,000 | $90,800 |
| 2019 | $1,596 | $115,800 | $0 | $0 |
| 2018 | $1,588 | $115,800 | $0 | $0 |
| 2017 | $1,588 | $115,800 | $0 | $0 |
| 2016 | $1,700 | $121,200 | $0 | $0 |
| 2015 | $1,709 | $121,200 | $0 | $0 |
| 2014 | $1,738 | $121,200 | $0 | $0 |
Source: Public Records
Map
Nearby Homes
- 705 Delmont St
- 1113 Clyde Place
- 610 Colonial Dr
- 510 Gatewood Ave
- 630 Colonial Dr
- 421 Gatewood Ave
- 810 Ferndale Blvd
- 304 Louise Ave
- 510 Otteray Ave
- 207 Hillcrest Dr
- 300 Edgedale Dr
- 1004 Adams St
- 1013 Ferndale Blvd
- 705 Carr St
- 1116 Ferndale Blvd
- 427 Woodbrook Dr
- 1042 Rockford Rd
- 1307 Tipton St
- 317 W High Ave Unit 15A
- 112 Briggs Place Unit A & B