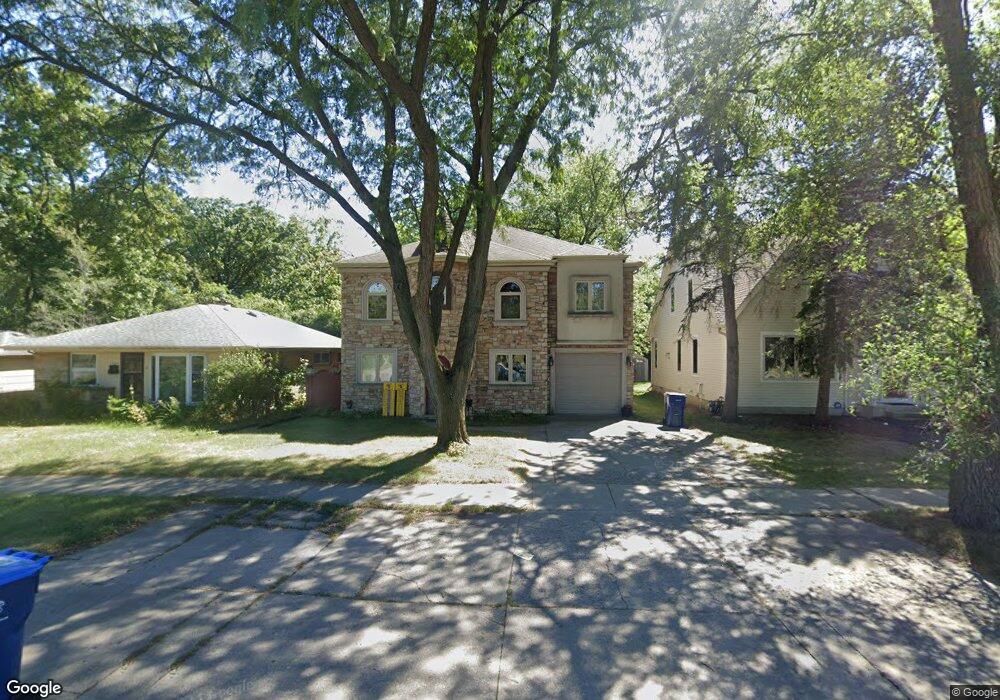
611 Dundee Rd Northbrook, IL 60062
Estimated Value: $711,000 - $919,000
4
Beds
4
Baths
2,782
Sq Ft
$296/Sq Ft
Est. Value
About This Home
This home is located at 611 Dundee Rd, Northbrook, IL 60062 and is currently estimated at $824,755, approximately $296 per square foot. 611 Dundee Rd is a home located in Cook County with nearby schools including Meadowbrook Elementary School, Northbrook Junior High School, and Glenbrook North High School.
Ownership History
Date
Name
Owned For
Owner Type
Purchase Details
Closed on
Jan 21, 2010
Sold by
Ing Bank Fsb
Bought by
Stout Jonathan
Current Estimated Value
Purchase Details
Closed on
Apr 14, 2009
Sold by
Galezewski Damian
Bought by
Ing Bak Fsb
Purchase Details
Closed on
Dec 18, 2006
Sold by
Smoter Piotr and Smoter Daria
Bought by
Galezewski Damian
Home Financials for this Owner
Home Financials are based on the most recent Mortgage that was taken out on this home.
Original Mortgage
$712,500
Interest Rate
6.87%
Mortgage Type
Purchase Money Mortgage
Purchase Details
Closed on
May 28, 2002
Sold by
Blumstein Scott and Blumstein Muriel
Bought by
Smoter Piotr and Smoter Daria
Home Financials for this Owner
Home Financials are based on the most recent Mortgage that was taken out on this home.
Original Mortgage
$223,250
Interest Rate
6.25%
Create a Home Valuation Report for This Property
The Home Valuation Report is an in-depth analysis detailing your home's value as well as a comparison with similar homes in the area
Home Values in the Area
Average Home Value in this Area
Purchase History
| Date | Buyer | Sale Price | Title Company |
|---|---|---|---|
| Stout Jonathan | $355,000 | Fatic | |
| Ing Bak Fsb | -- | None Available | |
| Galezewski Damian | $950,500 | Attorneys Title Guaranty Fun | |
| Smoter Piotr | -- | -- |
Source: Public Records
Mortgage History
| Date | Status | Borrower | Loan Amount |
|---|---|---|---|
| Previous Owner | Galezewski Damian | $712,500 | |
| Previous Owner | Smoter Piotr | $223,250 |
Source: Public Records
Tax History
| Year | Tax Paid | Tax Assessment Tax Assessment Total Assessment is a certain percentage of the fair market value that is determined by local assessors to be the total taxable value of land and additions on the property. | Land | Improvement |
|---|---|---|---|---|
| 2025 | $12,950 | $65,000 | $6,875 | $58,125 |
| 2024 | $12,950 | $60,000 | $7,150 | $52,850 |
| 2023 | $12,537 | $60,000 | $7,150 | $52,850 |
| 2022 | $12,537 | $60,000 | $7,150 | $52,850 |
| 2021 | $13,517 | $57,437 | $5,775 | $51,662 |
| 2020 | $13,302 | $57,437 | $5,775 | $51,662 |
| 2019 | $12,911 | $63,118 | $5,775 | $57,343 |
| 2018 | $13,445 | $60,849 | $5,087 | $55,762 |
| 2017 | $13,111 | $60,849 | $5,087 | $55,762 |
| 2016 | $12,520 | $60,849 | $5,087 | $55,762 |
| 2015 | $11,258 | $50,142 | $4,262 | $45,880 |
| 2014 | $10,766 | $50,142 | $4,262 | $45,880 |
| 2013 | $10,421 | $50,142 | $4,262 | $45,880 |
Source: Public Records
Map
Nearby Homes
- 1013 Longaker Rd
- 1025 Longaker Rd
- 535 Fairway Ln
- 1 Morrison Rd
- 440 Lee Rd
- 1135 Buttonwood Ln
- 24 Bridlewood Rd
- 754 Woodridge Ln
- 1133 Mayfair Ln
- 759 Strawberry Hill Dr
- 1106 Hohlfelder Rd
- 34 Bridlewood Rd
- 1380 Rosemary Ln
- 8 Heritage Dr
- 1180 Oak Ridge Dr
- 1125 Lake Cook Rd Unit 405
- 1125 Lake Cook Rd Unit 501
- 1125 Lake Cook Rd Unit 209
- 1220 Rudolph Rd Unit 3H
- 1220 Rudolph Rd Unit 1B
Your Personal Tour Guide
Ask me questions while you tour the home.