Estimated Value: $113,769 - $150,000
--
Bed
1
Bath
960
Sq Ft
$141/Sq Ft
Est. Value
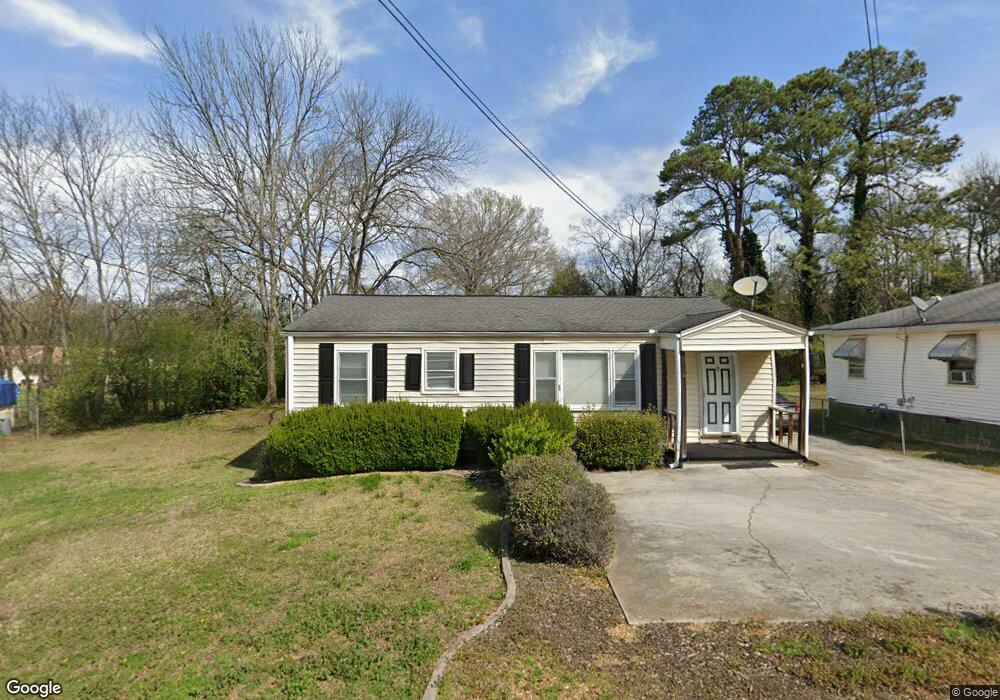
About This Home
This home is located at 611 E 19th St SW, Rome, GA 30161 and is currently estimated at $134,942, approximately $140 per square foot. 611 E 19th St SW is a home located in Floyd County with nearby schools including Dan McCarty Middle School, Rome High School, and Montessori School of Rome.
Ownership History
Date
Name
Owned For
Owner Type
Purchase Details
Closed on
Jul 20, 2009
Sold by
White-Jones Erika N
Bought by
White Erika N
Current Estimated Value
Purchase Details
Closed on
Nov 6, 2003
Sold by
Jones Effie L
Bought by
Jones Marcus C and White-Jone Erika N
Purchase Details
Closed on
Mar 5, 1991
Sold by
Jones Grady and Jones Grady Effie L
Bought by
Jones Effie L
Purchase Details
Closed on
Nov 6, 1984
Bought by
R P P and R P
Purchase Details
Closed on
May 23, 1975
Sold by
Thurman James F Thurman James F Thurma
Bought by
Jones Grady and Jones Grady Effie L
Purchase Details
Closed on
May 13, 1974
Sold by
Plemons Mrs Elizabeth Plemons Mrs Eliz
Bought by
Thurman James F Thurman James F Thu
Purchase Details
Closed on
Mar 24, 1972
Sold by
Dashier James Dashier James Dashier Ja
Bought by
Plemons Mrs Elizabeth Plemons Mrs E
Purchase Details
Closed on
Jan 1, 1901
Bought by
Dashier James Dashier James Dashier
Create a Home Valuation Report for This Property
The Home Valuation Report is an in-depth analysis detailing your home's value as well as a comparison with similar homes in the area
Home Values in the Area
Average Home Value in this Area
Purchase History
| Date | Buyer | Sale Price | Title Company |
|---|---|---|---|
| White Erika N | -- | -- | |
| Jones Marcus C | $73,500 | -- | |
| Jones Effie L | -- | -- | |
| P | -- | -- | |
| R P P | -- | -- | |
| Jones Grady | $17,900 | -- | |
| Thurman James F Thurman James F Thu | $15,600 | -- | |
| Plemons Mrs Elizabeth Plemons Mrs E | $10,500 | -- | |
| Dashier James Dashier James Dashier | -- | -- |
Source: Public Records
Tax History Compared to Growth
Tax History
| Year | Tax Paid | Tax Assessment Tax Assessment Total Assessment is a certain percentage of the fair market value that is determined by local assessors to be the total taxable value of land and additions on the property. | Land | Improvement |
|---|---|---|---|---|
| 2024 | $1,461 | $37,465 | $5,280 | $32,185 |
| 2023 | $822 | $31,857 | $4,800 | $27,057 |
| 2022 | $746 | $25,916 | $3,840 | $22,076 |
| 2021 | $707 | $23,227 | $3,840 | $19,387 |
| 2020 | $675 | $21,144 | $3,000 | $18,144 |
| 2019 | $648 | $19,900 | $3,000 | $16,900 |
| 2018 | $626 | $18,656 | $3,000 | $15,656 |
| 2017 | $614 | $17,916 | $3,000 | $14,916 |
| 2016 | $601 | $17,464 | $3,000 | $14,464 |
| 2015 | $568 | $17,464 | $3,000 | $14,464 |
| 2014 | $568 | $17,464 | $3,000 | $14,464 |
Source: Public Records
Map
Nearby Homes
- 414 E 17th St SW
- 1705 Olmstead St SW
- 111 Hosea St SW
- 14 Clover St SW
- 1502 Spring Creek St SW
- 4 E 15th St SW
- 304 E 19th St SW
- 000 E Oglethorpe Hwy
- 2014 Maple Ave SW
- 39 E 16th St SW
- 2512 Callier Springs Rd SE
- 1314 E 2nd Ave SE
- 1901 Hull Ave SW
- 13 Townview Rd SE
- 2108 Maple Ave SW
- 31 Notasulga Dr SW
- 12 Turnbull Dr SE
- 106 E 14th St SW
- 170 E 11th St SW
- 613 E 19th St SW
- 609 E 19th St SW
- 606 Brown St SW
- 604 Brown St SW
- 1815 Flannery St SW
- 610 Brown St SW
- 610 Brown St SW
- 610 E 19th St SW
- 612 E 19th St SW
- 608 E 19th St SW
- 614 E 19th St SW
- 1817 Flannery St SW
- 1813 Flannery St SW
- 1901 Flannery St SW
- 616 E 19th St SW
- 1903 Flannery St SW
- 605 Brown St SW
- 605 Brown St SW
- 609 Brown St SW
- 609 Brown St SW