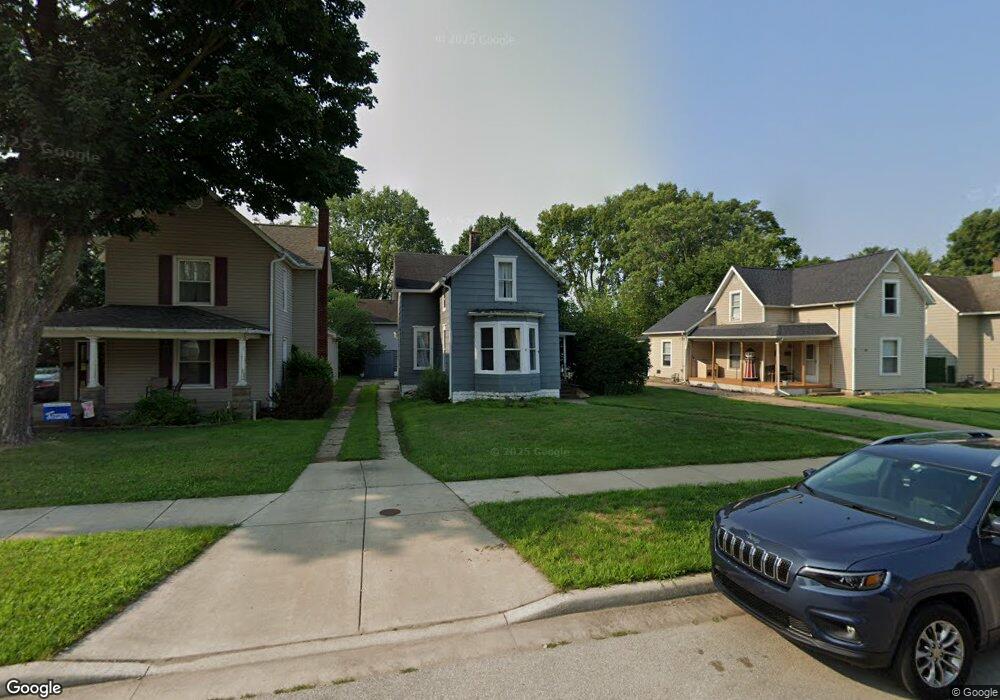
611 E 4th St Mishawaka, IN 46544
Estimated Value: $154,000 - $207,000
5
Beds
1
Bath
2,301
Sq Ft
$77/Sq Ft
Est. Value
About This Home
This home is located at 611 E 4th St, Mishawaka, IN 46544 and is currently estimated at $178,307, approximately $77 per square foot. 611 E 4th St is a home located in St. Joseph County with nearby schools including Beiger Elementary School, John J. Young Middle School, and Mishawaka High School.
Ownership History
Date
Name
Owned For
Owner Type
Purchase Details
Closed on
Nov 13, 2020
Sold by
Sailor Michelle
Bought by
Dimmitt Kayla Marie and Purtha Nicole K
Current Estimated Value
Home Financials for this Owner
Home Financials are based on the most recent Mortgage that was taken out on this home.
Original Mortgage
$95,000
Outstanding Balance
$83,567
Interest Rate
2.8%
Mortgage Type
New Conventional
Estimated Equity
$94,741
Purchase Details
Closed on
Dec 10, 2012
Sold by
Connon Kenneth Herbert
Bought by
Connon Kenneth P
Create a Home Valuation Report for This Property
The Home Valuation Report is an in-depth analysis detailing your home's value as well as a comparison with similar homes in the area
Home Values in the Area
Average Home Value in this Area
Purchase History
| Date | Buyer | Sale Price | Title Company |
|---|---|---|---|
| Dimmitt Kayla Marie | -- | None Listed On Document | |
| Sailor Michelle | -- | None Listed On Document | |
| Connon Kenneth P | $95,000 | None Available |
Source: Public Records
Mortgage History
| Date | Status | Borrower | Loan Amount |
|---|---|---|---|
| Open | Dimmitt Kayla Marie | $95,000 |
Source: Public Records
Tax History
| Year | Tax Paid | Tax Assessment Tax Assessment Total Assessment is a certain percentage of the fair market value that is determined by local assessors to be the total taxable value of land and additions on the property. | Land | Improvement |
|---|---|---|---|---|
| 2025 | $1,123 | $102,700 | $34,600 | $68,100 |
| 2024 | $1,185 | $101,100 | $34,600 | $66,500 |
| 2023 | $1,185 | $106,300 | $34,600 | $71,700 |
| 2022 | $1,201 | $106,300 | $34,600 | $71,700 |
| 2021 | $923 | $83,400 | $17,800 | $65,600 |
| 2020 | $701 | $78,000 | $16,700 | $61,300 |
| 2019 | $638 | $74,900 | $16,000 | $58,900 |
| 2018 | $511 | $61,700 | $13,100 | $48,600 |
| 2017 | $478 | $55,900 | $13,100 | $42,800 |
| 2016 | $455 | $55,900 | $13,100 | $42,800 |
| 2014 | $411 | $55,100 | $13,100 | $42,000 |
Source: Public Records
Map
Nearby Homes
- 418 S Merrifield Ave Unit 2
- 304 E 8th St
- 131 E 6th St
- 433 Park Ave
- 1005 E 3rd St
- 116 W 10th St
- 1015 E Grove St
- 402 W 7th St
- 116 W Mishawaka Ave Unit 401
- 116 W Mishawaka Ave Unit 202
- 530 W 5th St
- 523 W 6th St
- 1307 E 4th St
- 911 N Division
- 112 W Grove St
- 803 N Main St
- 550 Lincolnway W
- 215 E Broadway St
- 526 Kamm Island Place Unit 12
- 815 N Main St
Your Personal Tour Guide
Ask me questions while you tour the home.