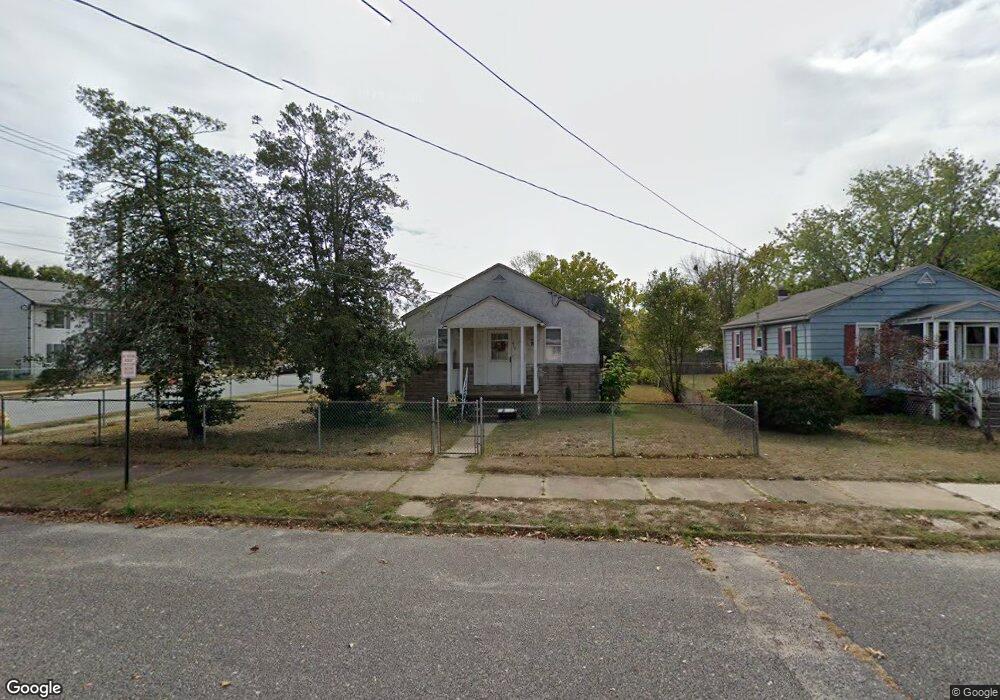
611 F St Millville, NJ 08332
Estimated Value: $207,478 - $228,000
3
Beds
1
Bath
1,008
Sq Ft
$217/Sq Ft
Est. Value
About This Home
This home is located at 611 F St, Millville, NJ 08332 and is currently estimated at $218,620, approximately $216 per square foot. 611 F St is a home located in Cumberland County with nearby schools including Silver Run Elementary School, Holly Heights Elementary School, and Lakeside Middle School.
Ownership History
Date
Name
Owned For
Owner Type
Purchase Details
Closed on
Jun 14, 2006
Sold by
Hand Earl C and Hand Janice J
Bought by
Hand Brian
Current Estimated Value
Purchase Details
Closed on
Jul 26, 2002
Sold by
Woeller Mabel
Bought by
Hand Earl and Hand Janice
Home Financials for this Owner
Home Financials are based on the most recent Mortgage that was taken out on this home.
Original Mortgage
$63,200
Outstanding Balance
$27,087
Interest Rate
6.73%
Estimated Equity
$191,533
Create a Home Valuation Report for This Property
The Home Valuation Report is an in-depth analysis detailing your home's value as well as a comparison with similar homes in the area
Home Values in the Area
Average Home Value in this Area
Purchase History
| Date | Buyer | Sale Price | Title Company |
|---|---|---|---|
| Hand Brian | $140,000 | -- | |
| Hand Earl | $79,000 | -- |
Source: Public Records
Mortgage History
| Date | Status | Borrower | Loan Amount |
|---|---|---|---|
| Open | Hand Earl | $63,200 |
Source: Public Records
Tax History Compared to Growth
Tax History
| Year | Tax Paid | Tax Assessment Tax Assessment Total Assessment is a certain percentage of the fair market value that is determined by local assessors to be the total taxable value of land and additions on the property. | Land | Improvement |
|---|---|---|---|---|
| 2025 | $3,866 | $98,500 | $23,300 | $75,200 |
| 2024 | $3,866 | $98,500 | $23,300 | $75,200 |
| 2023 | $3,834 | $98,500 | $23,300 | $75,200 |
| 2022 | $3,734 | $98,500 | $23,300 | $75,200 |
| 2021 | $3,613 | $98,500 | $23,300 | $75,200 |
| 2020 | $3,553 | $98,500 | $23,300 | $75,200 |
| 2019 | $3,388 | $98,500 | $23,300 | $75,200 |
| 2018 | $3,318 | $98,500 | $23,300 | $75,200 |
| 2017 | $3,288 | $98,500 | $23,300 | $75,200 |
| 2016 | $3,247 | $98,500 | $23,300 | $75,200 |
| 2015 | $3,174 | $98,500 | $23,300 | $75,200 |
| 2014 | $3,180 | $98,500 | $23,300 | $75,200 |
Source: Public Records
Map
Nearby Homes