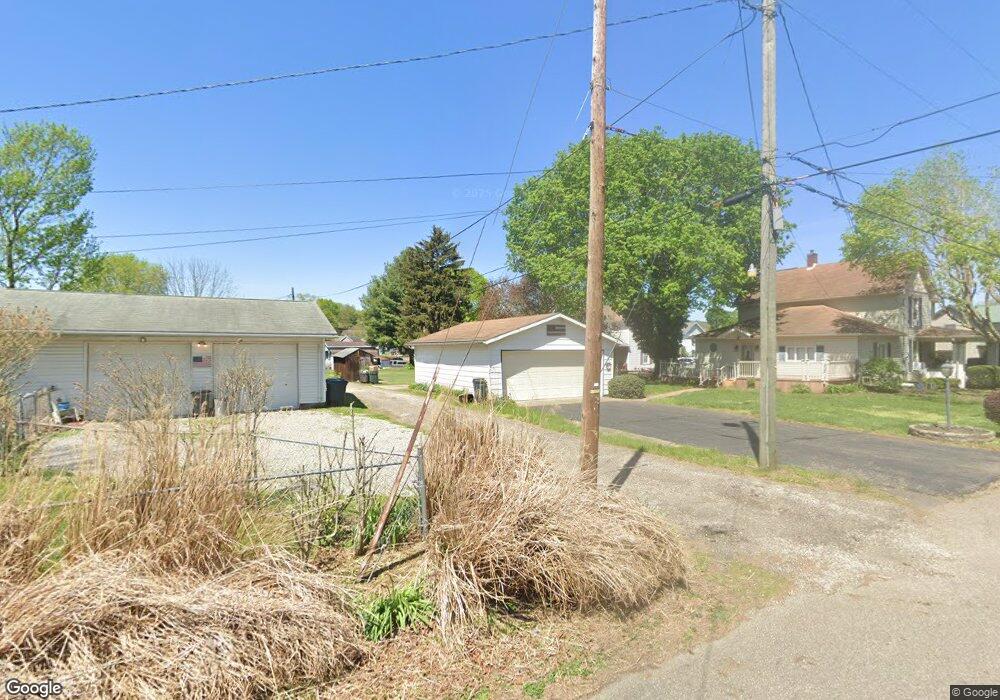
611 Franklin Ave Conesville, OH 43811
Estimated Value: $131,349 - $185,000
3
Beds
2
Baths
1,600
Sq Ft
$101/Sq Ft
Est. Value
About This Home
This home is located at 611 Franklin Ave, Conesville, OH 43811 and is currently estimated at $161,837, approximately $101 per square foot. 611 Franklin Ave is a home located in Coshocton County with nearby schools including River View High School.
Ownership History
Date
Name
Owned For
Owner Type
Purchase Details
Closed on
Dec 11, 2023
Sold by
Ulrich Amy M
Bought by
Locke Shawn A
Current Estimated Value
Home Financials for this Owner
Home Financials are based on the most recent Mortgage that was taken out on this home.
Original Mortgage
$111,111
Outstanding Balance
$109,357
Interest Rate
7.76%
Mortgage Type
Credit Line Revolving
Estimated Equity
$52,480
Purchase Details
Closed on
May 19, 2009
Sold by
Ulrich Harold R and Ulrich Amy M
Bought by
Ulrich Harold R and Ulrich Amy W
Purchase Details
Closed on
Jan 20, 2007
Sold by
Ulrich Harold R and Ulrich Amy M
Bought by
Ulrich Harold R
Purchase Details
Closed on
Aug 5, 2003
Sold by
Ulrich Harol R
Bought by
Ulrich Harol R
Purchase Details
Closed on
Jul 30, 2003
Sold by
Whiteus Karen S
Bought by
Ulrich Harol R
Create a Home Valuation Report for This Property
The Home Valuation Report is an in-depth analysis detailing your home's value as well as a comparison with similar homes in the area
Home Values in the Area
Average Home Value in this Area
Purchase History
| Date | Buyer | Sale Price | Title Company |
|---|---|---|---|
| Locke Shawn A | $102,000 | Fidelity National Title | |
| Ulrich Harold R | -- | None Available | |
| Ulrich Harold R | -- | None Available | |
| Ulrich Harol R | -- | -- | |
| Ulrich Harold R | -- | -- | |
| Ulrich Harol R | $75,000 | -- |
Source: Public Records
Mortgage History
| Date | Status | Borrower | Loan Amount |
|---|---|---|---|
| Open | Locke Shawn A | $111,111 |
Source: Public Records
Tax History Compared to Growth
Tax History
| Year | Tax Paid | Tax Assessment Tax Assessment Total Assessment is a certain percentage of the fair market value that is determined by local assessors to be the total taxable value of land and additions on the property. | Land | Improvement |
|---|---|---|---|---|
| 2024 | $1,230 | $31,920 | $2,800 | $29,120 |
| 2023 | $1,230 | $26,229 | $1,960 | $24,269 |
| 2022 | $1,043 | $26,229 | $1,960 | $24,269 |
| 2021 | $1,043 | $26,229 | $1,960 | $24,269 |
| 2020 | $942 | $23,370 | $1,533 | $21,837 |
| 2019 | $962 | $23,370 | $1,533 | $21,837 |
| 2018 | $892 | $23,370 | $1,533 | $21,837 |
| 2017 | $753 | $19,268 | $1,365 | $17,903 |
| 2016 | $714 | $19,268 | $1,365 | $17,903 |
| 2015 | $751 | $19,268 | $1,365 | $17,903 |
| 2014 | $751 | $20,661 | $1,365 | $19,296 |
Source: Public Records
Map
Nearby Homes
- 615 Franklin Ave
- 621 Franklin Ave
- 15713 State Route 16
- 46580 Township Road 479
- 17967 Township Road 347
- 18090 State Route 16
- 18224 County Road 6
- 2609 S 7th St
- 17981 Township Road 347
- 20413 Township Road 1184
- 0 Pleasant Valley Dr
- 14240 Lot# 58 Cr 410
- 10550 Symmes Creek Rd
- 1681 Knob Hill Dr
- 935 S 7th St
- 1720 Buena Vista Dr
- 914 S Lawn Ave
- 21569 State Route 16
- 14405 Ohio 83
- 2079 Buena Vista Dr
- 613 Franklin Ave
- 504 Franklin Ave
- 608 Franklin Ave
- 612 Adams St
- 612 Franklin Ave
- 721 Duncan St
- 614 Franklin Ave
- 608 Adams St
- 720 Duncan St
- 606 Adams St
- 618 Adams St
- 618 Franklin Ave
- 613 Marquand Ave
- 508 Franklin Ave
- 602 Adams St
- 620 Franklin Ave
- 615 Marquand Ave
- 611 Marquand Ave
- 506 Franklin Ave
- 505 Franklin Ave