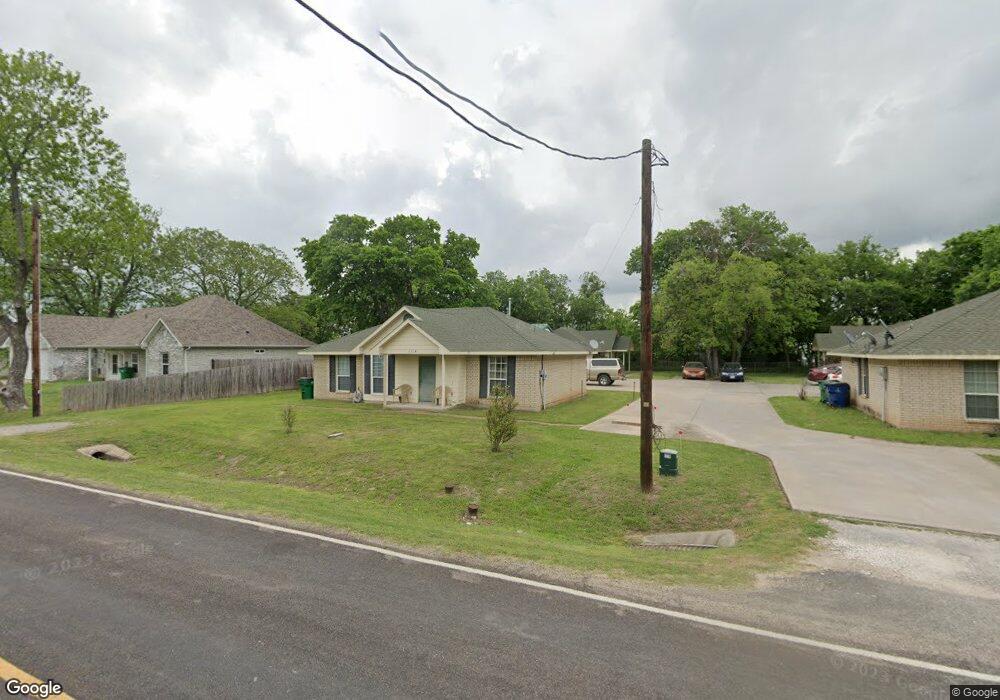
611 Grayson St Unit A Pottsboro, TX 75076
Estimated Value: $396,000
--
Bed
--
Bath
2,254
Sq Ft
$176/Sq Ft
Est. Value
About This Home
This home is located at 611 Grayson St Unit A, Pottsboro, TX 75076 and is currently estimated at $396,000, approximately $175 per square foot. 611 Grayson St Unit A is a home located in Grayson County with nearby schools including Pottsboro Elementary School, Pottsboro Middle School, and Pottsboro High School.
Ownership History
Date
Name
Owned For
Owner Type
Purchase Details
Closed on
Jul 9, 2021
Sold by
Outlook Land Holdings Llc
Bought by
Caladium Investments Llc
Current Estimated Value
Home Financials for this Owner
Home Financials are based on the most recent Mortgage that was taken out on this home.
Original Mortgage
$480,000
Outstanding Balance
$435,526
Interest Rate
2.9%
Mortgage Type
Commercial
Estimated Equity
-$39,526
Purchase Details
Closed on
Aug 10, 2016
Sold by
Evans Jerry W and Evans Debbie J
Bought by
Outlook Land Holdings Llc
Home Financials for this Owner
Home Financials are based on the most recent Mortgage that was taken out on this home.
Original Mortgage
$306,636
Interest Rate
3.48%
Mortgage Type
Purchase Money Mortgage
Purchase Details
Closed on
May 28, 2004
Sold by
Armstrong Amber Dawn
Bought by
Evans Jerry W and Evans Debbie J
Create a Home Valuation Report for This Property
The Home Valuation Report is an in-depth analysis detailing your home's value as well as a comparison with similar homes in the area
Home Values in the Area
Average Home Value in this Area
Purchase History
| Date | Buyer | Sale Price | Title Company |
|---|---|---|---|
| Caladium Investments Llc | -- | Red River Title | |
| Outlook Land Holdings Llc | -- | Red River Title Co | |
| Evans Jerry W | -- | -- |
Source: Public Records
Mortgage History
| Date | Status | Borrower | Loan Amount |
|---|---|---|---|
| Open | Caladium Investments Llc | $480,000 | |
| Previous Owner | Outlook Land Holdings Llc | $306,636 |
Source: Public Records
Tax History Compared to Growth
Tax History
| Year | Tax Paid | Tax Assessment Tax Assessment Total Assessment is a certain percentage of the fair market value that is determined by local assessors to be the total taxable value of land and additions on the property. | Land | Improvement |
|---|---|---|---|---|
| 2025 | $7,069 | $366,304 | $78,511 | $287,793 |
| 2024 | $7,069 | $366,304 | $78,511 | $287,793 |
| 2023 | $6,183 | $320,000 | $58,234 | $261,766 |
| 2022 | $5,761 | $271,905 | $52,940 | $218,965 |
| 2021 | $5,757 | $259,554 | $44,590 | $214,964 |
| 2020 | $5,546 | $241,984 | $44,590 | $197,394 |
| 2019 | $5,589 | $232,892 | $28,724 | $204,168 |
| 2018 | $4,802 | $198,259 | $11,489 | $186,770 |
| 2017 | $4,533 | $184,958 | $11,489 | $173,469 |
| 2016 | $4,533 | $184,941 | $10,449 | $174,492 |
| 2015 | $0 | $152,703 | $12,636 | $140,067 |
| 2014 | -- | $153,479 | $12,636 | $140,843 |
Source: Public Records
Map
Nearby Homes
- 614 Franklin Ave
- 617 Grayson St
- 401 Grayson St
- 405 Grayson St
- 622 Franklin Ave
- Lot 39 White Tail Way
- 308 Front St
- 105 E William St
- 102 William St
- 408 Front St
- 505 S Magnolia St
- 200 Herberta St
- 206 S Magnolia St
- 412 Main St
- 104 Loraine St
- TBD Cardinal Ln
- 110 E Fm 120
- 106 Cardinal Ln
- 106 Kristy Ct
- TBD Lot 4 Farm To Market 120
- 611 Grayson St
- 611 Grayson St Unit B
- 613 Grayson St Unit A
- 609 Grayson St
- 615 Grayson St
- 605 Grayson St
- 610 Franklin Ave
- 608 Franklin Ave
- 612 Franklin Ave
- 603 Grayson St
- 105 Texas St
- 601 Grayson St
- 602 Franklin Ave
- 616 Franklin Ave
- 600 Franklin Ave
- 619 Grayson St
- 618 Franklin Ave
- 621 Grayson St
- 617 Franklin Ave Unit 1
- 611 Franklin Ave