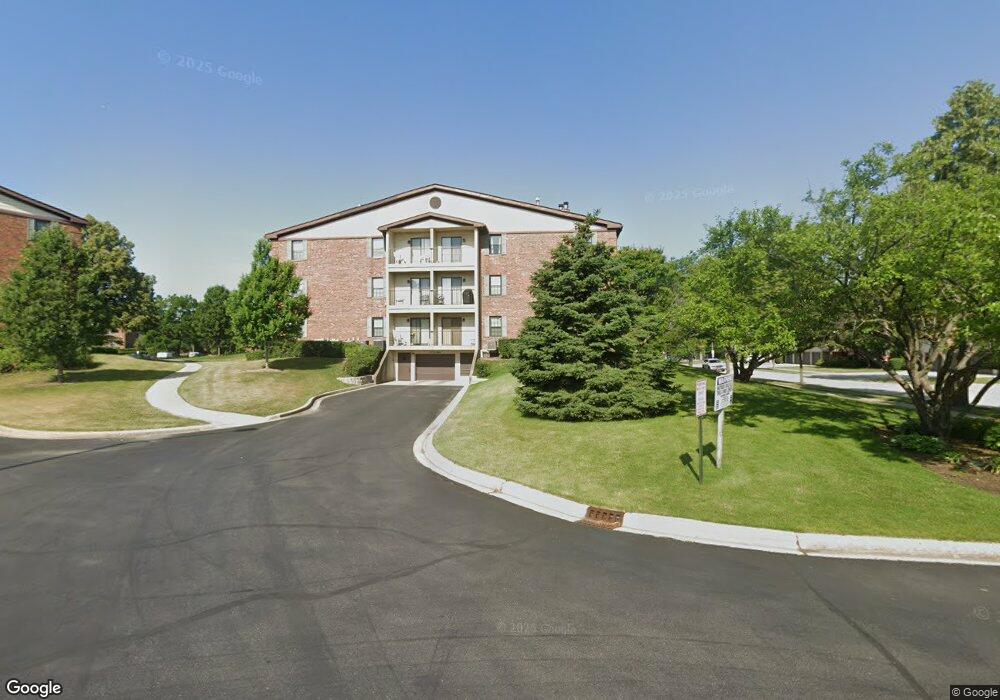
611 Hapsfield Ln Unit 611104 Buffalo Grove, IL 60089
South Buffalo Grove NeighborhoodEstimated Value: $221,000 - $229,000
2
Beds
--
Bath
1,095
Sq Ft
$204/Sq Ft
Est. Value
About This Home
This home is located at 611 Hapsfield Ln Unit 611104, Buffalo Grove, IL 60089 and is currently estimated at $223,638, approximately $204 per square foot. 611 Hapsfield Ln Unit 611104 is a home located in Cook County with nearby schools including Henry W Longfellow Elementary School, Cooper Middle School, and Buffalo Grove High School.
Ownership History
Date
Name
Owned For
Owner Type
Purchase Details
Closed on
Sep 3, 2020
Sold by
Utley W David and W David Utley Trust
Bought by
Areen Marilee
Current Estimated Value
Purchase Details
Closed on
Sep 20, 2019
Sold by
Bain Utley W and Bain Utley Patricia
Bought by
Utley W David and W David Utley Trust
Purchase Details
Closed on
Jul 9, 2004
Sold by
Wiatrowski Christy Marie
Bought by
Utley W David and Bain Utley Patricia
Purchase Details
Closed on
Mar 23, 2001
Sold by
Durlacher David L
Bought by
Wiatrowski Christy Marie
Home Financials for this Owner
Home Financials are based on the most recent Mortgage that was taken out on this home.
Original Mortgage
$104,800
Interest Rate
7.07%
Purchase Details
Closed on
Oct 6, 1995
Sold by
Senescu Howard A
Bought by
Durlacher David L
Home Financials for this Owner
Home Financials are based on the most recent Mortgage that was taken out on this home.
Original Mortgage
$73,800
Interest Rate
6.87%
Create a Home Valuation Report for This Property
The Home Valuation Report is an in-depth analysis detailing your home's value as well as a comparison with similar homes in the area
Home Values in the Area
Average Home Value in this Area
Purchase History
| Date | Buyer | Sale Price | Title Company |
|---|---|---|---|
| Areen Marilee | $145,000 | Attorneys Ttl Guaranty Fund | |
| Utley W David | -- | Attorney | |
| Utley W David | $160,000 | Ticor | |
| Wiatrowski Christy Marie | $131,000 | -- | |
| Durlacher David L | $92,500 | -- |
Source: Public Records
Mortgage History
| Date | Status | Borrower | Loan Amount |
|---|---|---|---|
| Previous Owner | Wiatrowski Christy Marie | $104,800 | |
| Previous Owner | Durlacher David L | $73,800 |
Source: Public Records
Tax History Compared to Growth
Tax History
| Year | Tax Paid | Tax Assessment Tax Assessment Total Assessment is a certain percentage of the fair market value that is determined by local assessors to be the total taxable value of land and additions on the property. | Land | Improvement |
|---|---|---|---|---|
| 2024 | $3,580 | $14,503 | $481 | $14,022 |
| 2023 | $3,412 | $14,503 | $481 | $14,022 |
| 2022 | $3,412 | $14,503 | $481 | $14,022 |
| 2021 | $3,339 | $12,780 | $106 | $12,674 |
| 2020 | $4,394 | $12,780 | $106 | $12,674 |
| 2019 | $4,384 | $14,161 | $106 | $14,055 |
| 2018 | $3,177 | $9,226 | $93 | $9,133 |
| 2017 | $3,119 | $9,226 | $93 | $9,133 |
| 2016 | $2,898 | $9,226 | $93 | $9,133 |
| 2015 | $2,718 | $8,002 | $227 | $7,775 |
| 2014 | $2,673 | $8,002 | $227 | $7,775 |
| 2013 | $2,471 | $8,002 | $227 | $7,775 |
Source: Public Records
Map
Nearby Homes
- 665 Thornwood Dr
- 820 Weidner Rd Unit 409
- 813 Stradford Cir Unit 21B2
- 859 Beechwood Rd
- 535 Estate Dr
- 3300 N Carriageway Dr Unit 317
- 561 Park View Terrace Unit 153
- 455 Mayfair Ln
- 410 Chatham Cir
- 1127 Miller Ln Unit 107
- 476 Raupp Blvd
- 972 Thornton Ln Unit 102
- 1115 Miller Ln Unit 104
- 408 Indian Hill Dr
- 3157 N Daniels Ct Unit 1502
- 18 E Heritage Ct
- 250 Old Oak Dr Unit 275
- 234 Mohawk Trail
- 310 Rosewood Ave
- 3227 N Heritage Ln
- 611 Hapsfield Ln Unit 307
- 611 Hapsfield Ln Unit 306
- 611 Hapsfield Ln Unit 107
- 611 Hapsfield Ln Unit 611206
- 611 Hapsfield Ln Unit 611204
- 611 Hapsfield Ln Unit 611303
- 611 Hapsfield Ln Unit 611307
- 611 Hapsfield Ln Unit 611102
- 611 Hapsfield Ln Unit 611301
- 611 Hapsfield Ln Unit 611105
- 611 Hapsfield Ln Unit 611302
- 611 Hapsfield Ln Unit 611306
- 611 Hapsfield Ln Unit 611203
- 611 Hapsfield Ln Unit 611106
- 611 Hapsfield Ln Unit 611201
- 611 Hapsfield Ln Unit 611207
- 611 Hapsfield Ln Unit 611200
- 611 Hapsfield Ln Unit 611300
- 611 Hapsfield Ln Unit 611103
- 611 Hapsfield Ln Unit 611101