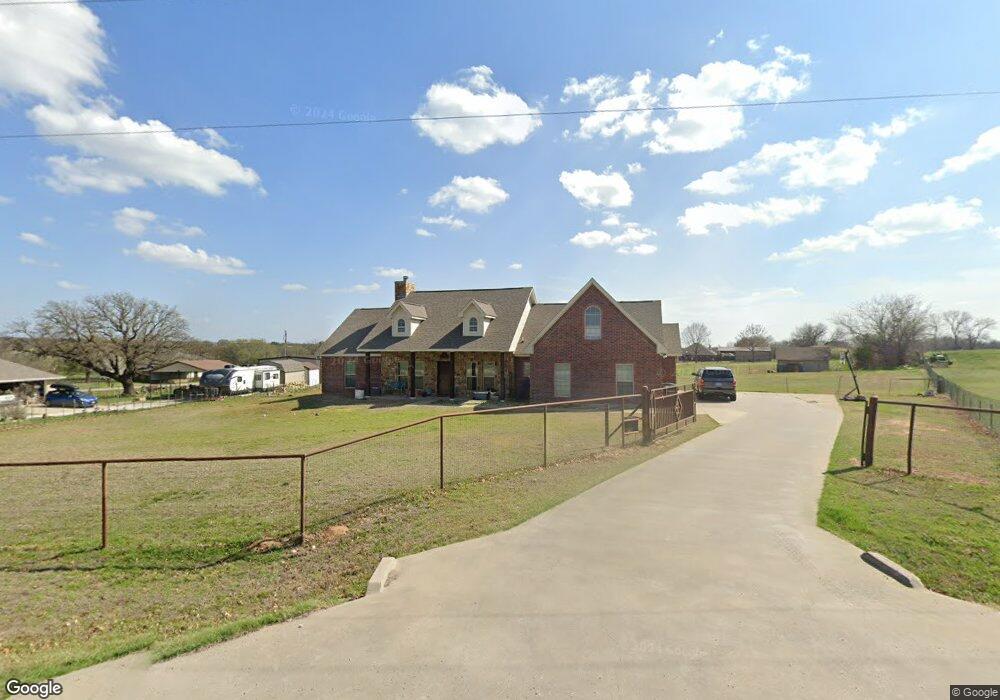
611 Harmony Rd Weatherford, TX 76087
Estimated Value: $447,268 - $559,000
--
Bed
--
Bath
2,559
Sq Ft
$200/Sq Ft
Est. Value
About This Home
This home is located at 611 Harmony Rd, Weatherford, TX 76087 and is currently estimated at $511,567, approximately $199 per square foot. 611 Harmony Rd is a home with nearby schools including Curtis Elementary School, Hall Middle School, and Weatherford High School.
Ownership History
Date
Name
Owned For
Owner Type
Purchase Details
Closed on
Nov 5, 2012
Sold by
Tidwell Ronnie and Tidwell Tammy
Bought by
Brysch Corey and Brysch Brittany
Current Estimated Value
Home Financials for this Owner
Home Financials are based on the most recent Mortgage that was taken out on this home.
Original Mortgage
$198,000
Outstanding Balance
$136,886
Interest Rate
3.4%
Mortgage Type
New Conventional
Estimated Equity
$374,681
Purchase Details
Closed on
Feb 25, 2011
Sold by
Merino Eduardo
Bought by
Brysch Corey and Tidwell Brittany
Home Financials for this Owner
Home Financials are based on the most recent Mortgage that was taken out on this home.
Original Mortgage
$215,000
Interest Rate
6.5%
Mortgage Type
New Conventional
Purchase Details
Closed on
Nov 2, 2010
Sold by
Riebe Albert and Riebe Shirley
Bought by
Brysch Corey and Brysch Brittany
Purchase Details
Closed on
Mar 31, 2004
Sold by
Barnett Phil
Bought by
Brysch Corey and Brysch Brittany
Create a Home Valuation Report for This Property
The Home Valuation Report is an in-depth analysis detailing your home's value as well as a comparison with similar homes in the area
Home Values in the Area
Average Home Value in this Area
Purchase History
| Date | Buyer | Sale Price | Title Company |
|---|---|---|---|
| Brysch Corey | -- | Stewart | |
| Brysch Corey | -- | Stnt | |
| Brysch Corey | -- | -- | |
| Merino Eduardo | -- | Stnt | |
| Brysch Corey | -- | -- |
Source: Public Records
Mortgage History
| Date | Status | Borrower | Loan Amount |
|---|---|---|---|
| Open | Brysch Corey | $198,000 | |
| Previous Owner | Brysch Corey | $215,000 |
Source: Public Records
Tax History Compared to Growth
Tax History
| Year | Tax Paid | Tax Assessment Tax Assessment Total Assessment is a certain percentage of the fair market value that is determined by local assessors to be the total taxable value of land and additions on the property. | Land | Improvement |
|---|---|---|---|---|
| 2025 | $6,107 | $468,020 | $80,000 | $388,020 |
| 2024 | $6,107 | $438,482 | -- | -- |
| 2023 | $6,107 | $398,620 | $0 | $0 |
| 2022 | $6,747 | $362,390 | $50,000 | $312,390 |
| 2021 | $6,931 | $362,390 | $50,000 | $312,390 |
| 2020 | $6,332 | $312,160 | $25,000 | $287,160 |
| 2019 | $6,558 | $312,160 | $25,000 | $287,160 |
| 2018 | $5,993 | $277,510 | $25,000 | $252,510 |
| 2017 | $5,559 | $277,510 | $25,000 | $252,510 |
| 2016 | $5,054 | $227,690 | $25,000 | $202,690 |
| 2015 | $4,987 | $227,690 | $25,000 | $202,690 |
| 2014 | $4,107 | $202,830 | $25,000 | $177,830 |
Source: Public Records
Map
Nearby Homes
- TBD Harmony Rd
- 566 Harmony Rd
- 130 Sunburst Ct
- 269 Harmony Rd
- 119 Greenbriar St
- 8135 Floor Plan at Old Oaks
- 8136 Floor Plan at Old Oaks
- 8137 Floor Plan at Old Oaks
- 8130 Floor Plan at Old Oaks
- 8125 Floor Plan at Old Oaks
- 8108 EP Floor Plan at Old Oaks
- 8126 Floor Plan at Old Oaks
- 8113 Floor Plan at Old Oaks
- 8121 Floor Plan at Old Oaks
- 622 Harmony Cir
- 1009 Old Oaks Ct
- 1041 Old Oaks Ct
- 1008 Old Oaks Ct
- 3147 Tin Top Rd
- 1170 Harmony Cir
- 601 Harmony Rd
- 110 Sunray Ct
- 630 Harmony Rd
- 656 Harmony Rd
- 114 Sunray Ct
- 585 Harmony Rd
- 107 Sunray Ct
- 647 Harmony Rd
- 657 Harmony Rd
- 111 Sunray Ct
- 118 Sunray Ct
- 680 Harmony Rd
- 119 Sunray Ct
- 673 Harmony Rd
- 122 Sunray Ct
- 106 Sun Valley Ln
- 123 Sunray Ct
- 112 Sun Valley Ln
- 100 Sun Valley Ln
- 692 Harmony Rd