611 Harold Pritchett Rd Ellijay, GA 30540
Estimated Value: $493,000 - $623,000
4
Beds
3
Baths
2,880
Sq Ft
$192/Sq Ft
Est. Value
About This Home
This home is located at 611 Harold Pritchett Rd, Ellijay, GA 30540 and is currently estimated at $553,507, approximately $192 per square foot. 611 Harold Pritchett Rd is a home located in Gilmer County with nearby schools including Mountain View Elementary School, Gilmer Middle School, and Clear Creek Middle School.
Ownership History
Date
Name
Owned For
Owner Type
Purchase Details
Closed on
Jun 20, 2025
Sold by
Simmons Harold
Bought by
Murphy Debra Lynne
Current Estimated Value
Purchase Details
Closed on
Jun 29, 2007
Sold by
Davis Mary C
Bought by
Murphy Debra L
Home Financials for this Owner
Home Financials are based on the most recent Mortgage that was taken out on this home.
Original Mortgage
$204,000
Interest Rate
6.13%
Mortgage Type
New Conventional
Purchase Details
Closed on
Feb 28, 2005
Sold by
Colwell Tonya M
Bought by
Clowell Chris B
Purchase Details
Closed on
Feb 25, 2005
Sold by
Colwell Chris B
Bought by
Davis Mary C and Collier George E
Purchase Details
Closed on
Oct 29, 2003
Sold by
Colwell Chris B and Colwell Tonya
Bought by
Colwell Chris B
Purchase Details
Closed on
Mar 21, 2001
Sold by
Colwell Ronnie L and Colwell Linda F
Bought by
Colwell Chris B
Create a Home Valuation Report for This Property
The Home Valuation Report is an in-depth analysis detailing your home's value as well as a comparison with similar homes in the area
Home Values in the Area
Average Home Value in this Area
Purchase History
| Date | Buyer | Sale Price | Title Company |
|---|---|---|---|
| Murphy Debra Lynne | $28,000 | -- | |
| Murphy Debra L | $255,000 | -- | |
| Clowell Chris B | -- | -- | |
| Davis Mary C | $199,500 | -- | |
| Colwell Chris B | -- | -- | |
| Colwell Chris B | -- | -- |
Source: Public Records
Mortgage History
| Date | Status | Borrower | Loan Amount |
|---|---|---|---|
| Previous Owner | Murphy Debra L | $204,000 |
Source: Public Records
Tax History Compared to Growth
Tax History
| Year | Tax Paid | Tax Assessment Tax Assessment Total Assessment is a certain percentage of the fair market value that is determined by local assessors to be the total taxable value of land and additions on the property. | Land | Improvement |
|---|---|---|---|---|
| 2024 | $682 | $213,212 | $22,240 | $190,972 |
| 2023 | $701 | $212,892 | $21,920 | $190,972 |
| 2022 | $729 | $172,892 | $19,400 | $153,492 |
| 2021 | $2,518 | $137,748 | $15,440 | $122,308 |
| 2020 | $2,480 | $115,432 | $15,360 | $100,072 |
| 2019 | $2,553 | $115,432 | $15,360 | $100,072 |
| 2018 | $2,575 | $115,432 | $15,360 | $100,072 |
| 2017 | $2,210 | $91,700 | $9,120 | $82,580 |
| 2016 | $2,279 | $92,672 | $9,120 | $83,552 |
| 2015 | $2,389 | $98,820 | $16,840 | $81,980 |
| 2014 | $2,471 | $98,372 | $16,840 | $81,532 |
| 2013 | -- | $80,520 | $11,240 | $69,280 |
Source: Public Records
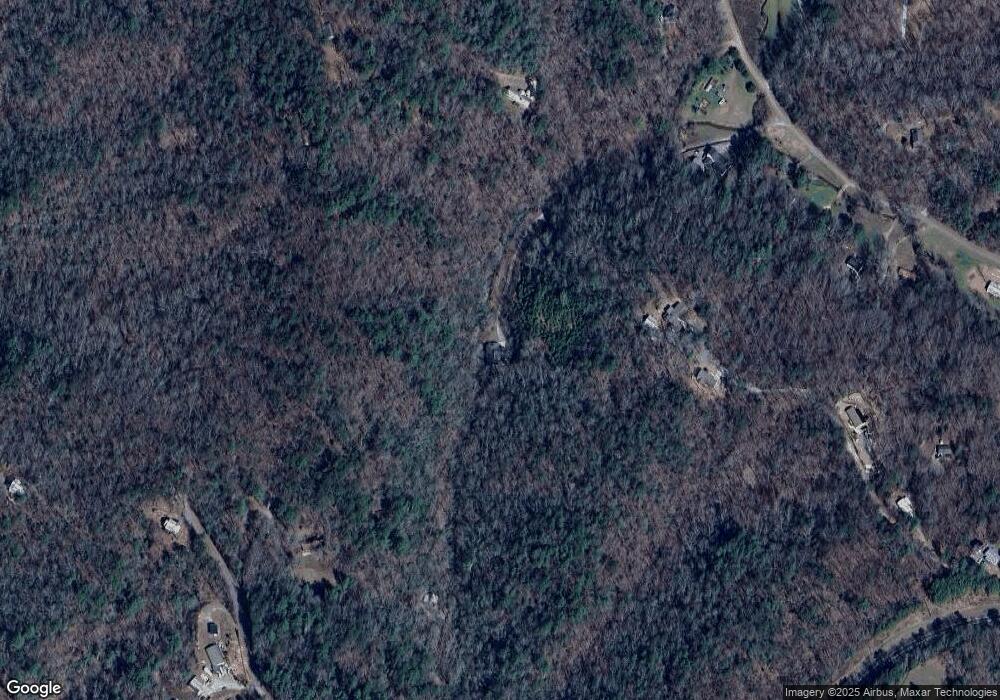
Map
Nearby Homes
- LT 60 Honeysuckle Way
- L 29&30 Eastside Dr
- 240 Kennedy Ln
- LOT 108 High River
- LOT 164R High River
- 0 First Ave Unit 10511188
- 0 Walhalla Lot 387 Ct Unit 6109499
- 0 Reece Mountain Rd Unit 7663580
- 0 Reece Mountain Rd Unit 10622182
- LT 17R Tanager Trail
- 0 High River Rd Unit 419208
- 0 High River Rd Unit 7651483
- 0 High River Rd Unit 10608415
- 0 N Harris Creek Dr Unit 10590397
- 0 N Harris Creek Dr Unit 7637623
- 0 Flagpole Cir Unit 417397
- 0 Flagpole Cir Unit 10568056
- 10323 Grassy Mountain Rd
- 0 High River Rd Unit 10543629
- 0 High River Rd Unit 7597383
- 226 Logan Ridge Trail
- 607 Harold Pritchett Rd
- 378 Deer Stand Dr
- 378 Deerstand Dr
- 671 Harold Pritchett Rd
- 275 Duke Trail
- 174 Logan Ridge Trail
- 0 High River Landing Unit LOT 59 10266044
- 587 Dowell Cir
- LOT 2 Highland Cir
- LT 74 Hilton Dr
- 587 Dowell Cir Unit 181,182
- 3.71 Acres Grandview Ln
- LT 113 High River Crossing
- L24 Essex Dr Unit 24
- L24 Essex Dr
- 242 High River Crossing
- 39 High River Landing- High River
- Lot 39 High River Landing- High River
- LOT 2 Highland Cir Unit 2