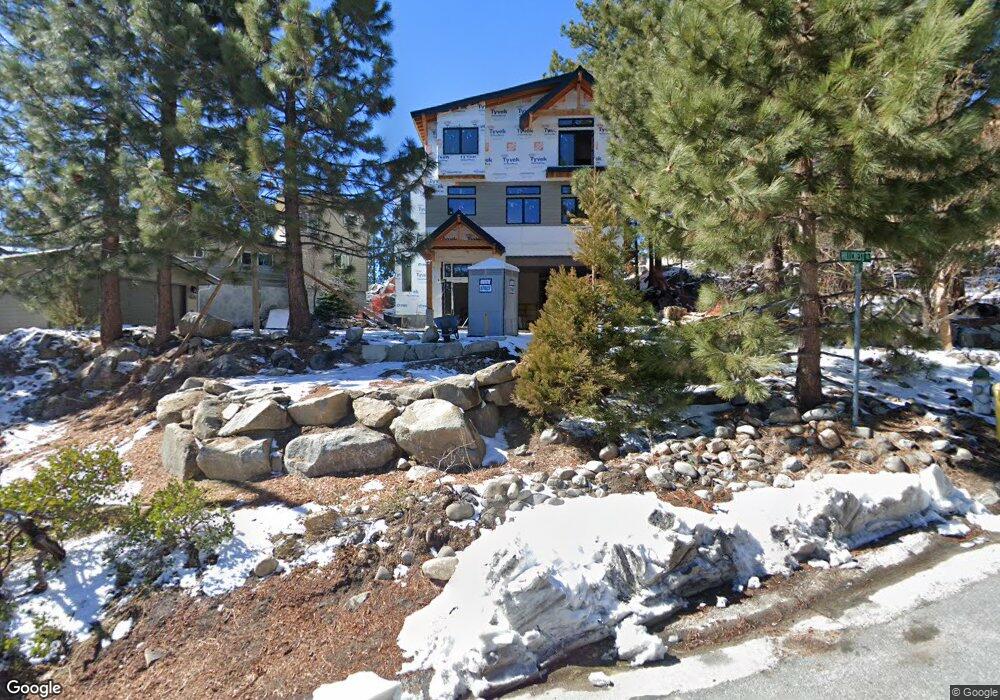
611 Hillcrest Dr Zephyr Cove, NV 89448
Estimated Value: $1,313,000 - $2,819,000
3
Beds
3
Baths
1,323
Sq Ft
$1,663/Sq Ft
Est. Value
About This Home
This home is located at 611 Hillcrest Dr, Zephyr Cove, NV 89448 and is currently estimated at $2,200,735, approximately $1,663 per square foot. 611 Hillcrest Dr is a home located in Douglas County with nearby schools including Zephyr Cove Elementary School, George Whittell High School, and Douglas County High School.
Ownership History
Date
Name
Owned For
Owner Type
Purchase Details
Closed on
Feb 22, 2009
Sold by
Brooks Sky Jewel
Bought by
Huff Terence and Hokholt Lisa
Current Estimated Value
Home Financials for this Owner
Home Financials are based on the most recent Mortgage that was taken out on this home.
Original Mortgage
$225,000
Outstanding Balance
$142,075
Interest Rate
5.08%
Mortgage Type
Purchase Money Mortgage
Estimated Equity
$2,058,660
Create a Home Valuation Report for This Property
The Home Valuation Report is an in-depth analysis detailing your home's value as well as a comparison with similar homes in the area
Home Values in the Area
Average Home Value in this Area
Purchase History
| Date | Buyer | Sale Price | Title Company |
|---|---|---|---|
| Huff Terence | $515,000 | Northern Nevada Title Cc |
Source: Public Records
Mortgage History
| Date | Status | Borrower | Loan Amount |
|---|---|---|---|
| Open | Huff Terence | $225,000 |
Source: Public Records
Tax History Compared to Growth
Tax History
| Year | Tax Paid | Tax Assessment Tax Assessment Total Assessment is a certain percentage of the fair market value that is determined by local assessors to be the total taxable value of land and additions on the property. | Land | Improvement |
|---|---|---|---|---|
| 2025 | $10,034 | $377,668 | $162,750 | $214,918 |
| 2024 | $10,034 | $377,638 | $162,750 | $214,888 |
| 2023 | $9,328 | $361,044 | $162,750 | $198,294 |
| 2022 | $8,607 | $330,602 | $147,000 | $183,602 |
| 2021 | $7,967 | $301,548 | $127,750 | $173,798 |
| 2020 | $5,591 | $243,350 | $127,750 | $115,600 |
| 2019 | $3,575 | $183,988 | $127,750 | $56,238 |
| 2018 | $2,532 | $149,286 | $122,500 | $26,786 |
| 2017 | $2,462 | $149,959 | $122,500 | $27,459 |
| 2016 | $2,402 | $151,239 | $122,500 | $28,739 |
| 2015 | $2,396 | $151,239 | $122,500 | $28,739 |
| 2014 | $2,328 | $149,965 | $122,500 | $27,465 |
Source: Public Records
Map
Nearby Homes
- 670 Riven Rock Rd
- 227 S Martin Dr
- 606 Jerry Dr
- 605 Jerry Dr
- 621 Lakeview Dr
- 664 Lookout Rd
- 733 Lakeview Dr
- 225 S Martin Dr
- 600 U S 50 Unit 60
- 625 Lake Shore Blvd
- 5 Ute Ct
- 259 Mc Faul Ct
- 450 Mcfaul Way Unit 17
- 464 Elks Ave
- 128 Holly Ln Unit B
- 230 Clubhouse Cir
- 28 Beach Club Dr Unit 407
- 233 Clubhouse Cir
- 205 Clubhouse Cir
- 42 Beach Club Dr Unit 702