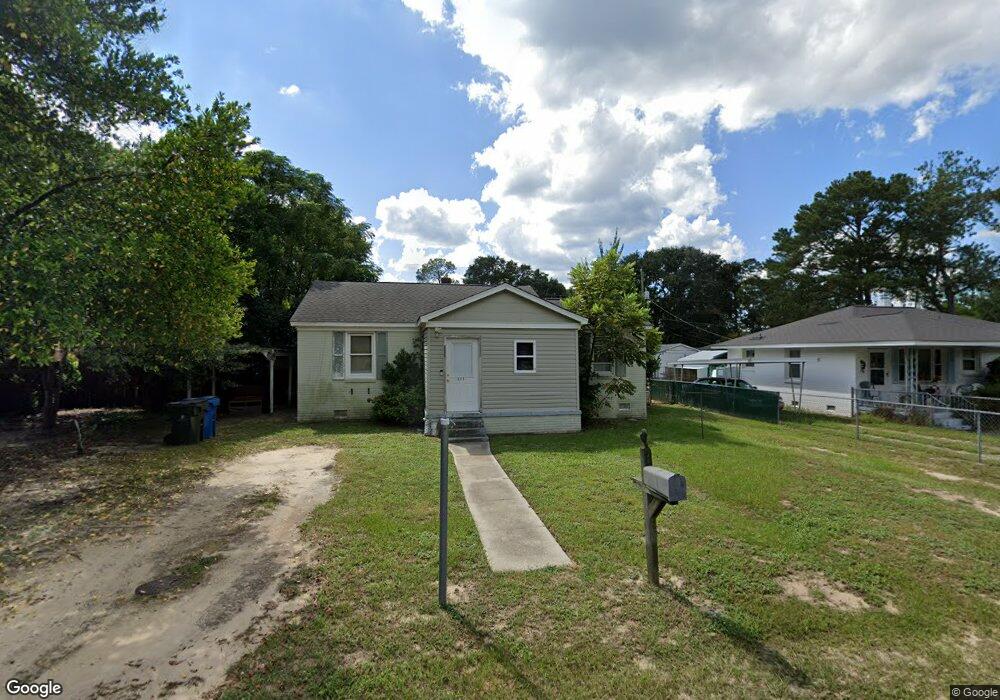
611 Holland Cir West Columbia, SC 29169
Estimated Value: $76,000 - $144,306
3
Beds
1
Bath
899
Sq Ft
$129/Sq Ft
Est. Value
About This Home
This home is located at 611 Holland Cir, West Columbia, SC 29169 and is currently estimated at $116,077, approximately $129 per square foot. 611 Holland Cir is a home located in Lexington County with nearby schools including Riverbank Elementary, Northside Middle, and Brookland-Cayce High School.
Ownership History
Date
Name
Owned For
Owner Type
Purchase Details
Closed on
Nov 14, 2023
Sold by
Skipper Properties Llc
Bought by
Truong Thanh-Truyen Thuy and Truong Thong Q
Current Estimated Value
Purchase Details
Closed on
Oct 31, 2023
Sold by
Lexington County
Bought by
Skipper Properties Llc and Eubank Mary Anne
Purchase Details
Closed on
Sep 4, 2008
Sold by
Wolfe Terry W and Wolfe Donna V
Bought by
Truong Thanh Truyen Thuy
Home Financials for this Owner
Home Financials are based on the most recent Mortgage that was taken out on this home.
Original Mortgage
$68,400
Interest Rate
6.48%
Mortgage Type
Purchase Money Mortgage
Purchase Details
Closed on
Sep 22, 2005
Sold by
Dodson Michael A
Bought by
Wolfe Terry W and Wolfe Donna
Home Financials for this Owner
Home Financials are based on the most recent Mortgage that was taken out on this home.
Original Mortgage
$41,000
Interest Rate
5.72%
Mortgage Type
Future Advance Clause Open End Mortgage
Create a Home Valuation Report for This Property
The Home Valuation Report is an in-depth analysis detailing your home's value as well as a comparison with similar homes in the area
Home Values in the Area
Average Home Value in this Area
Purchase History
| Date | Buyer | Sale Price | Title Company |
|---|---|---|---|
| Truong Thanh-Truyen Thuy | $75,000 | None Listed On Document | |
| Skipper Properties Llc | $71,731 | None Listed On Document | |
| Truong Thanh Truyen Thuy | $76,000 | -- | |
| Wolfe Terry W | $39,200 | -- |
Source: Public Records
Mortgage History
| Date | Status | Borrower | Loan Amount |
|---|---|---|---|
| Previous Owner | Truong Thanh Truyen Thuy | $68,400 | |
| Previous Owner | Wolfe Terry W | $41,000 |
Source: Public Records
Tax History Compared to Growth
Tax History
| Year | Tax Paid | Tax Assessment Tax Assessment Total Assessment is a certain percentage of the fair market value that is determined by local assessors to be the total taxable value of land and additions on the property. | Land | Improvement |
|---|---|---|---|---|
| 2024 | $608 | $4,500 | $1,200 | $3,300 |
| 2023 | $1,777 | $2,728 | $800 | $1,928 |
| 2022 | $527 | $2,728 | $800 | $1,928 |
| 2020 | $506 | $2,728 | $800 | $1,928 |
| 2019 | $488 | $2,582 | $800 | $1,782 |
| 2018 | $493 | $2,582 | $800 | $1,782 |
| 2017 | $473 | $2,582 | $800 | $1,782 |
| 2016 | $486 | $2,581 | $800 | $1,781 |
| 2014 | $433 | $3,023 | $800 | $2,223 |
| 2013 | -- | $3,000 | $800 | $2,200 |
Source: Public Records
Map
Nearby Homes
- 617 Holland Cir
- 1615 Holland St
- 106 Earl Ct
- 1513 Gambrell St
- 1344 Gilmore St
- 165 Cavendish Dr
- 638 Carrington Dr
- 324 N Parson St
- 1715 Gilvie Ave
- 2004 Dew Ave
- 929-931 Central Dr
- 1235 Jensen St
- 1734 C Ave
- 100 Double Branch Ct
- 108 Double Branch Ct
- 1452 C Ave
- 502A Koon St
- Tract 1 Hallelujah Rd
- 623 Hook Ave
- 207 Woodhaven Dr
- 613 Holland Cir
- 609 Holland Cir
- 641 Holland Cir
- 615 Holland Cir
- 643 Holland Cir
- 639 Holland Cir
- 610 Holland Cir
- 637 Holland Cir
- 612 Holland Cir
- 608 Holland Cir
- 605 Holland Cir
- 606 Holland Cir
- 614 Holland Cir
- 647 Holland Cir
- 647 Holland Cir
- 635 Holland Cir
- 603 Holland Cir
- 604 Holland Cir
- 616 Holland Cir
- 642 Holland Cir