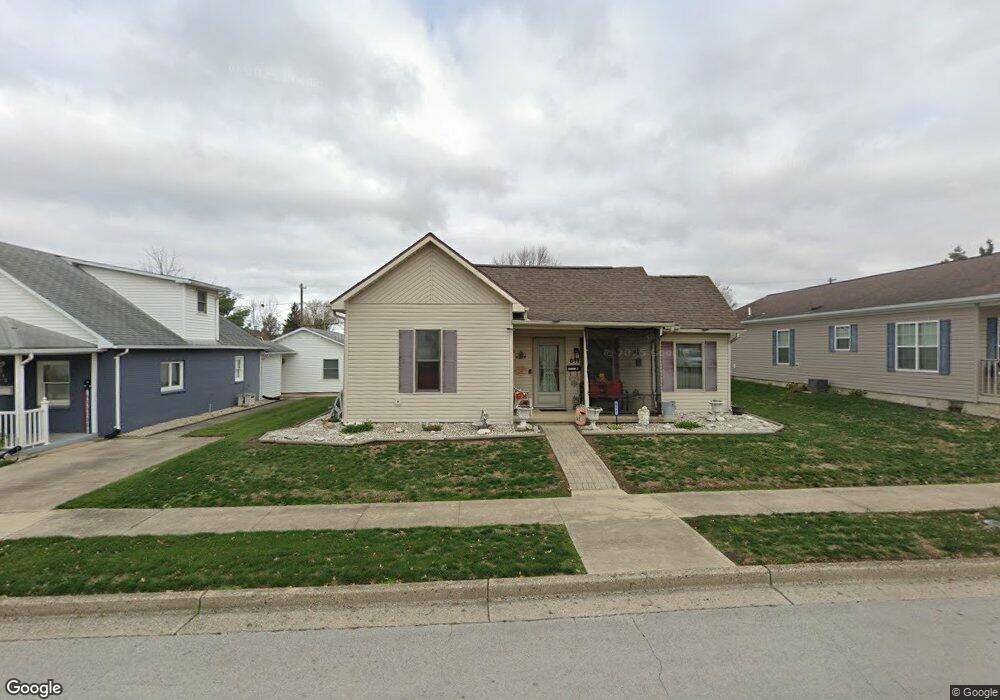
611 Hoying St Celina, OH 45822
Estimated Value: $139,000 - $198,000
2
Beds
2
Baths
984
Sq Ft
$160/Sq Ft
Est. Value
About This Home
This home is located at 611 Hoying St, Celina, OH 45822 and is currently estimated at $157,537, approximately $160 per square foot. 611 Hoying St is a home located in Mercer County with nearby schools including Celina Middle School, Celina High School, and Immaculate Conception School.
Ownership History
Date
Name
Owned For
Owner Type
Purchase Details
Closed on
Mar 14, 2014
Sold by
Hinton Joseph R and Hinton Catherine L
Bought by
Gonzalez Felicia F and Gonzalez Rogelio
Current Estimated Value
Home Financials for this Owner
Home Financials are based on the most recent Mortgage that was taken out on this home.
Original Mortgage
$58,000
Outstanding Balance
$43,794
Interest Rate
4.24%
Mortgage Type
New Conventional
Estimated Equity
$113,743
Purchase Details
Closed on
Feb 23, 2011
Sold by
Skinner Lori A
Bought by
Hinton Joseph R and Hinton Catheribe L
Home Financials for this Owner
Home Financials are based on the most recent Mortgage that was taken out on this home.
Original Mortgage
$77,564
Interest Rate
4.76%
Mortgage Type
New Conventional
Purchase Details
Closed on
Jan 3, 2007
Sold by
Cipollone Anthony N and Cipollone Jessica A
Bought by
Skinner Lori A
Home Financials for this Owner
Home Financials are based on the most recent Mortgage that was taken out on this home.
Original Mortgage
$93,532
Interest Rate
6.24%
Mortgage Type
FHA
Create a Home Valuation Report for This Property
The Home Valuation Report is an in-depth analysis detailing your home's value as well as a comparison with similar homes in the area
Home Values in the Area
Average Home Value in this Area
Purchase History
| Date | Buyer | Sale Price | Title Company |
|---|---|---|---|
| Gonzalez Felicia F | $116,200 | Attorney | |
| Hinton Joseph R | $71,000 | Attorney | |
| Skinner Lori A | $67,857 | None Available |
Source: Public Records
Mortgage History
| Date | Status | Borrower | Loan Amount |
|---|---|---|---|
| Open | Gonzalez Felicia F | $58,000 | |
| Previous Owner | Hinton Joseph R | $77,564 | |
| Previous Owner | Skinner Lori A | $93,532 |
Source: Public Records
Tax History Compared to Growth
Tax History
| Year | Tax Paid | Tax Assessment Tax Assessment Total Assessment is a certain percentage of the fair market value that is determined by local assessors to be the total taxable value of land and additions on the property. | Land | Improvement |
|---|---|---|---|---|
| 2024 | $1,703 | $43,200 | $6,130 | $37,070 |
| 2023 | $1,703 | $43,200 | $6,130 | $37,070 |
| 2022 | $1,289 | $28,530 | $3,610 | $24,920 |
| 2021 | $1,273 | $28,110 | $3,610 | $24,500 |
| 2020 | $1,067 | $28,110 | $3,610 | $24,500 |
| 2019 | $1,038 | $25,660 | $3,330 | $22,330 |
| 2018 | $1,079 | $25,660 | $3,330 | $22,330 |
| 2017 | $1,090 | $25,660 | $3,330 | $22,330 |
| 2016 | $1,102 | $26,500 | $3,330 | $23,170 |
| 2015 | $976 | $24,190 | $3,330 | $20,860 |
| 2014 | $920 | $22,760 | $3,330 | $19,430 |
| 2013 | $977 | $22,760 | $3,330 | $19,430 |
Source: Public Records
Map
Nearby Homes
- 628 Hoying St
- 627 N Sugar St
- 611 N Sugar St
- 618 W Livingston St
- 115 Touvelle St
- 325 N Walnut St
- 515 W Fayette St
- 680 N Main St
- 210 S Elm St
- 524 N Buckeye St
- 1528 Mary Ln
- 110 N Cherry St
- 1218 Brittany Dr
- 320 E Livingston St
- 630 Maple St
- 1101 Timothy Ln
- 836 Hemlock St
- 629 E Livingston St
- 522 Schunk Rd
- 802 E Market St