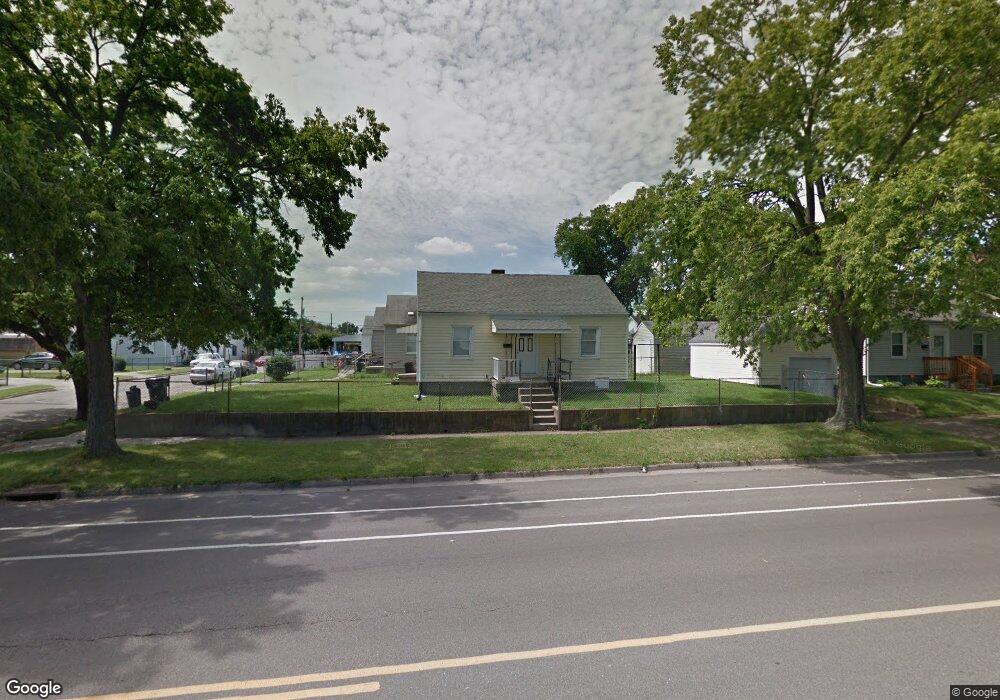
611 Joe Nuxhall Blvd Hamilton, OH 45011
East Hamilton NeighborhoodEstimated Value: $72,000 - $109,000
2
Beds
1
Bath
720
Sq Ft
$125/Sq Ft
Est. Value
About This Home
This home is located at 611 Joe Nuxhall Blvd, Hamilton, OH 45011 and is currently estimated at $90,351, approximately $125 per square foot. 611 Joe Nuxhall Blvd is a home located in Butler County with nearby schools including Fairwood Elementary School, Garfield Middle School, and Hamilton Freshman School.
Ownership History
Date
Name
Owned For
Owner Type
Purchase Details
Closed on
Dec 15, 2011
Sold by
Secretary Of Housing & Urban Development
Bought by
Jarvis Willie and Jarvis Irene
Current Estimated Value
Purchase Details
Closed on
Jun 21, 2011
Sold by
Rader Kyle R
Bought by
Us Bank National Association
Purchase Details
Closed on
Jun 9, 2011
Sold by
U S Bank National Association
Bought by
Secretary Of Housing & Urban Develoment
Purchase Details
Closed on
Mar 24, 2011
Sold by
Rader Kyle R
Bought by
U S Bank Na
Purchase Details
Closed on
Aug 11, 2008
Sold by
Blevins Fred and Blevins Jane
Bought by
Rader Kyle R
Home Financials for this Owner
Home Financials are based on the most recent Mortgage that was taken out on this home.
Original Mortgage
$52,342
Interest Rate
6.39%
Mortgage Type
FHA
Purchase Details
Closed on
Jan 1, 1990
Create a Home Valuation Report for This Property
The Home Valuation Report is an in-depth analysis detailing your home's value as well as a comparison with similar homes in the area
Home Values in the Area
Average Home Value in this Area
Purchase History
| Date | Buyer | Sale Price | Title Company |
|---|---|---|---|
| Jarvis Willie | $15,321 | None Available | |
| Us Bank National Association | $21,000 | None Available | |
| Secretary Of Housing & Urban Develoment | -- | None Available | |
| U S Bank Na | -- | None Available | |
| Rader Kyle R | $53,000 | Vintage Title Agency Inc | |
| -- | $34,000 | -- |
Source: Public Records
Mortgage History
| Date | Status | Borrower | Loan Amount |
|---|---|---|---|
| Previous Owner | Rader Kyle R | $52,342 |
Source: Public Records
Tax History Compared to Growth
Tax History
| Year | Tax Paid | Tax Assessment Tax Assessment Total Assessment is a certain percentage of the fair market value that is determined by local assessors to be the total taxable value of land and additions on the property. | Land | Improvement |
|---|---|---|---|---|
| 2024 | $547 | $9,700 | $940 | $8,760 |
| 2023 | $503 | $9,700 | $940 | $8,760 |
| 2022 | $467 | $7,450 | $940 | $6,510 |
| 2021 | $419 | $7,180 | $940 | $6,240 |
| 2020 | $432 | $7,180 | $940 | $6,240 |
| 2019 | $387 | $5,290 | $970 | $4,320 |
| 2018 | $338 | $5,290 | $970 | $4,320 |
| 2017 | $340 | $5,290 | $970 | $4,320 |
| 2016 | $331 | $4,870 | $970 | $3,900 |
| 2015 | $245 | $4,870 | $970 | $3,900 |
| 2014 | $727 | $4,870 | $970 | $3,900 |
| 2013 | $727 | $13,580 | $2,520 | $11,060 |
Source: Public Records
Map
Nearby Homes
- 808 Greenwood Ave
- 327 N 8th St
- 307 N 8th St
- 330 Buckeye St
- 317 Buckeye St
- 1217 Vine St
- 1019 Buckeye St
- 21 N 7th St
- 1017 Dayton St
- 911 Campbell Ave
- 5014 S Castle Ct
- 1223 Campbell Ave
- 301 N Fair Ave
- 603 Sycamore St
- 1327 Dayton St
- 113 Starr Ave
- 1327 Campbell Ave
- 120 Webster Ave
- 3883 Piper Ln
- 1114 Chestnut St