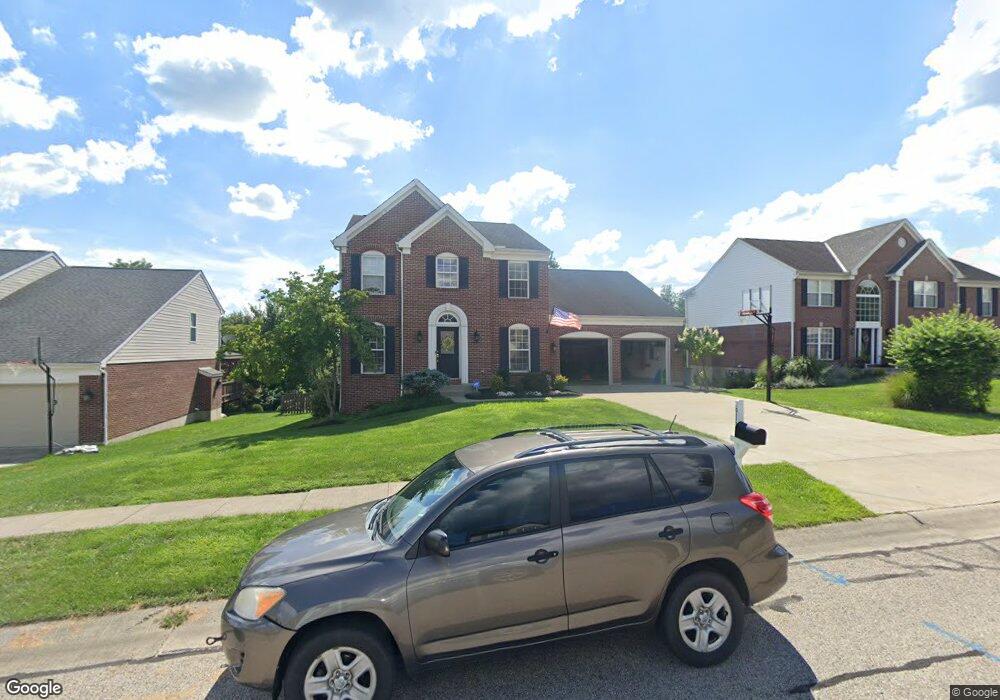
611 Laurelwood Dr Cleves, OH 45002
Estimated Value: $446,008 - $478,000
4
Beds
4
Baths
2,413
Sq Ft
$191/Sq Ft
Est. Value
About This Home
This home is located at 611 Laurelwood Dr, Cleves, OH 45002 and is currently estimated at $461,502, approximately $191 per square foot. 611 Laurelwood Dr is a home located in Hamilton County with nearby schools including Charles T. Young Elementary School, Taylor Middle School, and Taylor High School.
Ownership History
Date
Name
Owned For
Owner Type
Purchase Details
Closed on
Jul 31, 2023
Sold by
Volkerding Matthew T and Volkerding Tiffany N
Bought by
Autenrieb Joel David and Autenrieb Jenna Michelle
Current Estimated Value
Home Financials for this Owner
Home Financials are based on the most recent Mortgage that was taken out on this home.
Original Mortgage
$344,000
Outstanding Balance
$335,955
Interest Rate
6.67%
Mortgage Type
New Conventional
Estimated Equity
$125,547
Purchase Details
Closed on
Mar 8, 2013
Sold by
Selby Michael K and Selby Tracy L
Bought by
Volkerding Matthew T and Volkerding Tiffany N
Home Financials for this Owner
Home Financials are based on the most recent Mortgage that was taken out on this home.
Original Mortgage
$244,489
Interest Rate
3.25%
Mortgage Type
FHA
Create a Home Valuation Report for This Property
The Home Valuation Report is an in-depth analysis detailing your home's value as well as a comparison with similar homes in the area
Home Values in the Area
Average Home Value in this Area
Purchase History
| Date | Buyer | Sale Price | Title Company |
|---|---|---|---|
| Autenrieb Joel David | $430,000 | None Listed On Document | |
| Autenrieb Joel David | $430,000 | None Listed On Document | |
| Volkerding Matthew T | $249,000 | Prodigy Title Agency |
Source: Public Records
Mortgage History
| Date | Status | Borrower | Loan Amount |
|---|---|---|---|
| Open | Autenrieb Joel David | $344,000 | |
| Closed | Autenrieb Joel David | $344,000 | |
| Previous Owner | Volkerding Matthew T | $244,489 |
Source: Public Records
Tax History Compared to Growth
Tax History
| Year | Tax Paid | Tax Assessment Tax Assessment Total Assessment is a certain percentage of the fair market value that is determined by local assessors to be the total taxable value of land and additions on the property. | Land | Improvement |
|---|---|---|---|---|
| 2024 | $5,374 | $115,501 | $21,837 | $93,664 |
| 2023 | $5,420 | $115,501 | $21,837 | $93,664 |
| 2022 | $4,832 | $82,506 | $19,565 | $62,941 |
| 2021 | $4,703 | $82,506 | $19,565 | $62,941 |
| 2020 | $5,126 | $82,506 | $19,565 | $62,941 |
| 2019 | $4,969 | $73,665 | $17,469 | $56,196 |
| 2018 | $4,789 | $73,665 | $17,469 | $56,196 |
| 2017 | $4,509 | $73,665 | $17,469 | $56,196 |
| 2016 | $4,885 | $87,151 | $17,469 | $69,682 |
| 2015 | $4,937 | $87,151 | $17,469 | $69,682 |
| 2014 | $4,994 | $87,151 | $17,469 | $69,682 |
| 2013 | $4,444 | $77,064 | $17,469 | $59,595 |
Source: Public Records
Map
Nearby Homes
- 310 Spring St
- 110 Elliott St
- 101 E State Rd
- 194 E State Rd
- 301 N Miami Ave
- 116 Scott St
- 401 W Porter St
- 118 Western Ridge Dr
- Lot 262 Alexandras Way
- Lot 266 Alexandras Way
- 21 Wamsley Ave
- Lot 263 Alexandras Way
- 3889 Bear Ln
- 540 Aston View Ln
- 118 Mount Nebo Rd
- 23 Ridge Ave
- 542 Aston View Ln
- 215 Symmes St
- 517 E State Rd
- 525 E State Rd
- 609 Laurelwood Dr
- 613 Laurelwood Dr
- 607 Laurelwood Dr
- 618 Laurelwood Dr
- 615 Laurelwood Dr
- 620 Laurelwood Dr
- 616 Laurelwood Dr
- 614 Laurelwood Dr
- 605 Laurelwood Dr
- 617 Laurelwood Dr
- 624 Laurelwood Dr
- 612 Laurelwood Dr
- 622 Laurelwood Dr
- 603 Laurelwood Dr
- 610 Laurelwood Dr
- 602 Ledgeview Ct
- 601 Laurelwood Dr
- 608 Laurelwood Dr
- 230 E Howell St
- 606 Laurelwood Dr