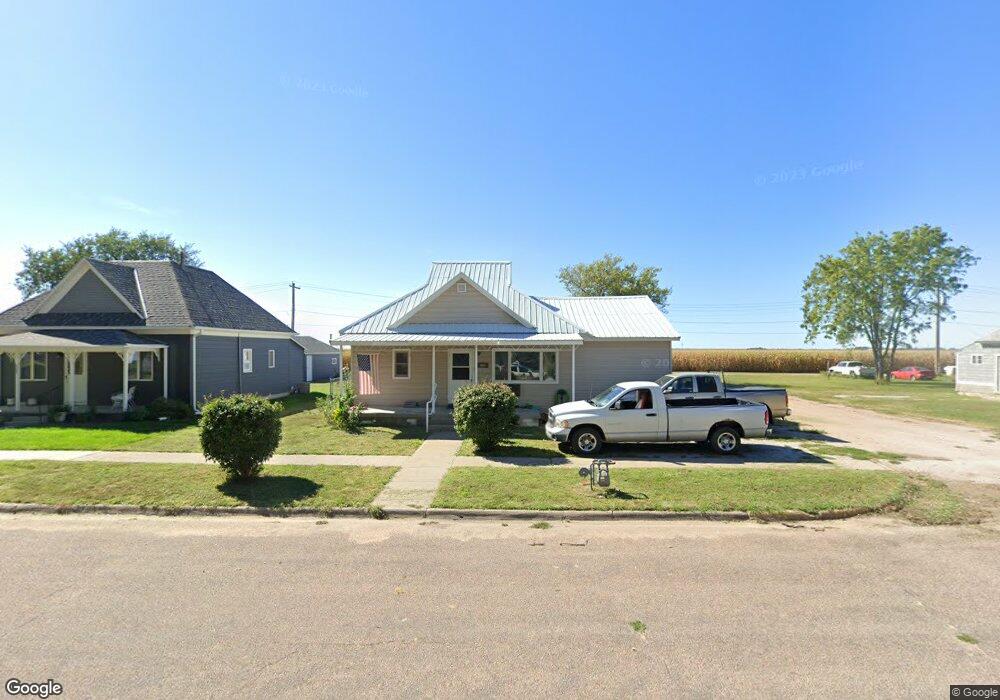
611 Marshall Ave Bertrand, NE 68927
Estimated Value: $138,000 - $152,000
--
Bed
--
Bath
1,174
Sq Ft
$122/Sq Ft
Est. Value
About This Home
This home is located at 611 Marshall Ave, Bertrand, NE 68927 and is currently estimated at $143,673, approximately $122 per square foot. 611 Marshall Ave is a home located in Phelps County with nearby schools including Bertrand Elementary School and Bertrand High School.
Ownership History
Date
Name
Owned For
Owner Type
Purchase Details
Closed on
Jan 12, 2022
Sold by
Fosbinder Patti L
Bought by
Fosbinder Bryan L
Current Estimated Value
Create a Home Valuation Report for This Property
The Home Valuation Report is an in-depth analysis detailing your home's value as well as a comparison with similar homes in the area
Home Values in the Area
Average Home Value in this Area
Purchase History
| Date | Buyer | Sale Price | Title Company |
|---|---|---|---|
| Fosbinder Bryan L | -- | None Listed On Document |
Source: Public Records
Tax History Compared to Growth
Tax History
| Year | Tax Paid | Tax Assessment Tax Assessment Total Assessment is a certain percentage of the fair market value that is determined by local assessors to be the total taxable value of land and additions on the property. | Land | Improvement |
|---|---|---|---|---|
| 2024 | $1,451 | $91,725 | $5,250 | $86,475 |
| 2023 | $1,569 | $74,330 | $4,200 | $70,130 |
| 2022 | $1,592 | $74,330 | $4,200 | $70,130 |
| 2021 | $1,439 | $67,395 | $4,200 | $63,195 |
| 2020 | $218 | $63,745 | $4,200 | $59,545 |
| 2019 | $905 | $61,025 | $4,200 | $56,825 |
| 2018 | $833 | $61,025 | $4,200 | $56,825 |
| 2017 | $853 | $59,590 | $3,430 | $56,160 |
| 2016 | $793 | $55,605 | $3,430 | $52,175 |
| 2015 | $792 | $55,605 | $3,430 | $52,175 |
| 2014 | $803 | $51,785 | $3,430 | $48,355 |
| 2013 | $803 | $51,785 | $3,430 | $48,355 |
Source: Public Records
Map
Nearby Homes
- 213 Minor Ave
- 201 Medina Ave
- Bertrand Unit NE 68927
- 74947 Road 435
- 608 Smith Ave
- 306 N Calvert Ave
- 401 1st Ave
- 117 W 3rd Ave
- 74769 L Rd
- 8 Park Lane Drive 28
- 38 E Shore Drive 1
- 816 Garfield St
- 516 Logan St
- 709 Lincoln St
- 1406 Pamela Ave
- 419 Sherman St
- 1326 10th Ave
- 205 9th St
- 912 B St
- 55 Mallard Beach Drive 21
- 609 Marshall Ave
- 607 Marshall Ave
- 1102 Kane Ave
- 605 Marshall Ave
- 705 Marshall Ave
- 612 Marshall Ave
- 1102 Kossuth Ave
- 608 Marshall Ave
- 702 Marshall Ave
- 606 Marshall Ave
- 707 Marshall Ave
- 604 Marshall Ave
- 711 Marshall Ave
- 511 Marshall Ave
- 609 Melbourne Ave
- 712 Marshall Ave
- 607 Melbourne Ave
- 701 Melbourne Ave
- 703 Melbourne Ave
- 705 Melbourne Ave