
611 Miami St Toledo, OH 43605
East Toledo NeighborhoodEstimated payment $587/month
Highlights
- Very Popular Property
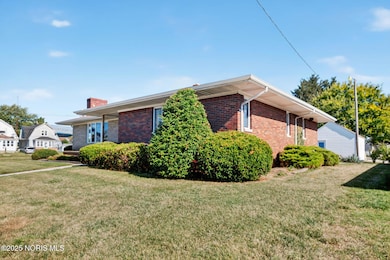
- Corner Lot
- Forced Air Heating System
- 0.4 Acre Lot
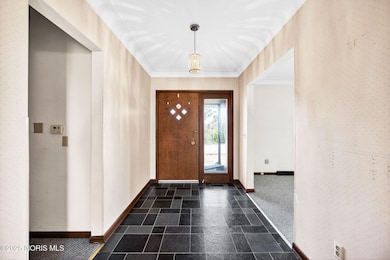
- Tile Flooring
- 4 Car Garage
About This Home
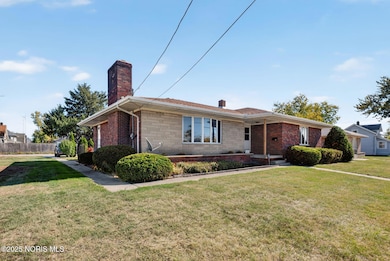
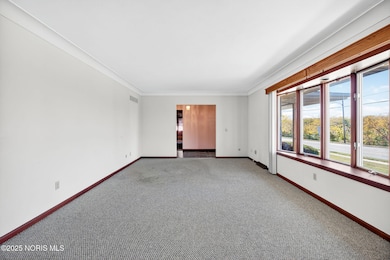
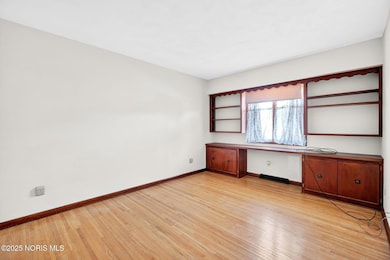
Charming 3-bedroom home featuring a spacious primary suite and three additional land parcels for an extra-large yard! Enjoy classic character with cove ceilings, bay windows, and a welcoming covered front porch. The home is move-in ready and includes a detached garage, full basement with two large bonus rooms—perfect for a home office, gym, or hobby space. Conveniently located near schools, The Docks, Glass City Metropark, and International Park. A wonderful blend of comfort, location, and charm! This home will be up for public auction on Monday November 17th at 4 PM. Preview and registration will begin at 3 PM.
Home Details
Home Type
- Single Family
Est. Annual Taxes
- $775
Year Built
- Built in 1969
Lot Details
- 0.4 Acre Lot
- Lot Dimensions are 82x117
- Corner Lot
Parking
- 4 Car Garage
- Alley Access
Home Design
- Brick Exterior Construction
- Shingle Roof
- Stone
Interior Spaces
- 1,828 Sq Ft Home
- 1-Story Property
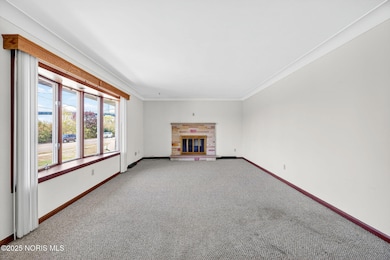
- Living Room with Fireplace
- Basement Fills Entire Space Under The House
Flooring
- Carpet
- Tile
Bedrooms and Bathrooms
- 3 Bedrooms
- 2 Full Bathrooms
Laundry
- Laundry on main level
- Gas Dryer Hookup
Schools
- Navarre Elementary School
- Waite High School
Utilities
- No Cooling
- Forced Air Heating System
- Heating System Uses Natural Gas
- 100 Amp Service
Listing and Financial Details
- Assessor Parcel Number 13-25182
Map
Home Values in the Area
Average Home Value in this Area
Tax History
| Year | Tax Paid | Tax Assessment Tax Assessment Total Assessment is a certain percentage of the fair market value that is determined by local assessors to be the total taxable value of land and additions on the property. | Land | Improvement |
|---|---|---|---|---|
| 2024 | $775 | $20,440 | $6,440 | $14,000 |
| 2023 | $1,724 | $22,575 | $8,820 | $13,755 |
| 2022 | $1,743 | $22,575 | $8,820 | $13,755 |
| 2021 | $1,756 | $22,575 | $8,820 | $13,755 |
| 2020 | $1,897 | $22,015 | $8,540 | $13,475 |
| 2019 | $1,877 | $22,015 | $8,540 | $13,475 |
| 2018 | $1,865 | $22,015 | $8,540 | $13,475 |
| 2017 | $1,934 | $21,490 | $8,330 | $13,160 |
| 2016 | $1,905 | $61,400 | $23,800 | $37,600 |
| 2015 | $1,877 | $61,400 | $23,800 | $37,600 |
| 2014 | $1,389 | $21,490 | $8,330 | $13,160 |
| 2013 | $1,389 | $21,490 | $8,330 | $13,160 |
Property History
| Date | Event | Price | List to Sale | Price per Sq Ft |
|---|---|---|---|---|
| 10/22/2025 10/22/25 | For Sale | $99,000 | -- | $54 / Sq Ft |
Purchase History
| Date | Type | Sale Price | Title Company |
|---|---|---|---|
| Fiduciary Deed | $290,000 | None Listed On Document | |
| Quit Claim Deed | -- | None Listed On Document | |
| Interfamily Deed Transfer | -- | -- |
Source: Northwest Ohio Real Estate Information Service (NORIS)
MLS Number: 10000432
APN: 13-25182
Disclaimer: Certain information contained herein is derived from information provided by parties other than Homes.com. All information provided is deemed reliable, but is not guaranteed to be accurate and should be independently verified.
![]() IDX information is provided exclusively for personal, non-commercial use, and may not be used for any purpose other than to identify prospective properties consumers may be interested in purchasing. Information is deemed reliable but not guaranteed. ©2025 NORIS. All rights reserved.
IDX information is provided exclusively for personal, non-commercial use, and may not be used for any purpose other than to identify prospective properties consumers may be interested in purchasing. Information is deemed reliable but not guaranteed. ©2025 NORIS. All rights reserved.
