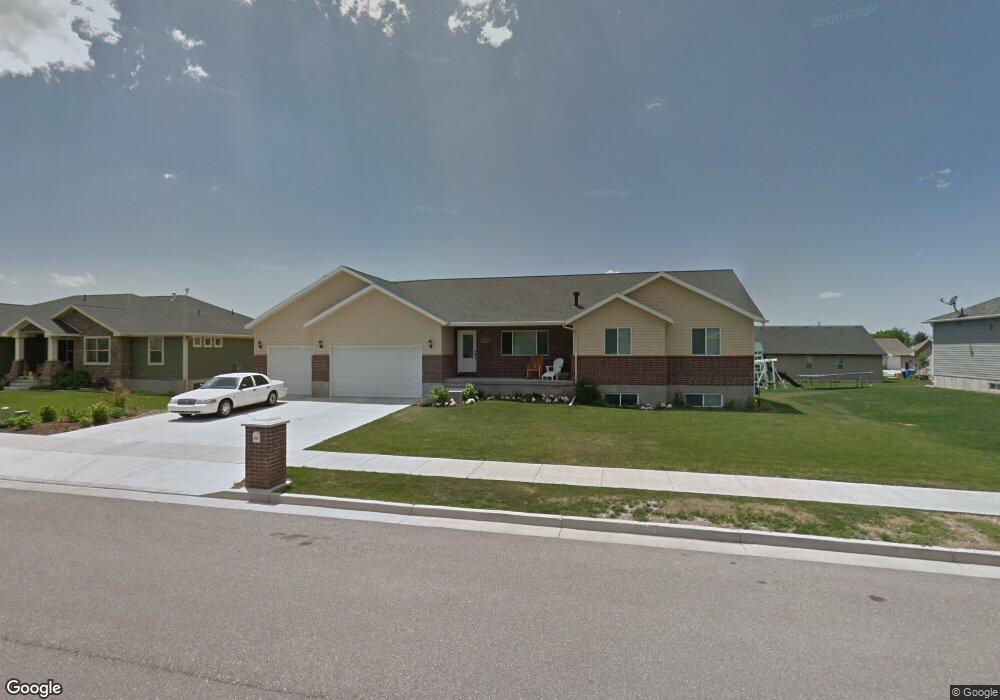
611 N 100 E Smithfield, UT 84335
Estimated Value: $529,000 - $636,000
Studio
--
Bath
2,012
Sq Ft
$296/Sq Ft
Est. Value
About This Home
This home is located at 611 N 100 E, Smithfield, UT 84335 and is currently estimated at $594,889, approximately $295 per square foot. 611 N 100 E is a home with nearby schools including Birch Creek School, North Cache Middle School, and White Pine Middle School.
Ownership History
Date
Name
Owned For
Owner Type
Purchase Details
Closed on
Feb 21, 2023
Sold by
Knight Family Trust
Bought by
J And L Property Protection Trust
Current Estimated Value
Purchase Details
Closed on
Nov 18, 2011
Sold by
Knight James P and Knight Elizabeth
Bought by
Knight James Paul and Knight Elizabeth Z
Home Financials for this Owner
Home Financials are based on the most recent Mortgage that was taken out on this home.
Original Mortgage
$136,500
Interest Rate
4.09%
Mortgage Type
New Conventional
Purchase Details
Closed on
Jul 28, 2009
Sold by
Hunter Meadows Development Company Inc
Bought by
Knight James P and Knight Elizabeth
Home Financials for this Owner
Home Financials are based on the most recent Mortgage that was taken out on this home.
Original Mortgage
$196,000
Interest Rate
5.31%
Mortgage Type
Construction
Create a Home Valuation Report for This Property
The Home Valuation Report is an in-depth analysis detailing your home's value as well as a comparison with similar homes in the area
Home Values in the Area
Average Home Value in this Area
Purchase History
| Date | Buyer | Sale Price | Title Company |
|---|---|---|---|
| J And L Property Protection Trust | -- | -- | |
| Knight James Paul | -- | Equity Title Union Heights | |
| Knight James P | -- | Northern Title Company |
Source: Public Records
Mortgage History
| Date | Status | Borrower | Loan Amount |
|---|---|---|---|
| Previous Owner | Knight James Paul | $136,500 | |
| Previous Owner | Knight James P | $196,000 |
Source: Public Records
Tax History
| Year | Tax Paid | Tax Assessment Tax Assessment Total Assessment is a certain percentage of the fair market value that is determined by local assessors to be the total taxable value of land and additions on the property. | Land | Improvement |
|---|---|---|---|---|
| 2025 | $2,643 | $353,805 | $0 | $0 |
| 2024 | $2,930 | $367,930 | $0 | $0 |
| 2023 | $3,072 | $364,870 | $0 | $0 |
| 2022 | $3,123 | $364,870 | $0 | $0 |
| 2021 | $2,209 | $394,304 | $70,000 | $324,304 |
| 2020 | $2,114 | $352,004 | $70,000 | $282,004 |
| 2019 | $2,091 | $332,004 | $50,000 | $282,004 |
| 2018 | $1,966 | $301,790 | $50,000 | $251,790 |
| 2017 | $1,901 | $159,390 | $0 | $0 |
| 2016 | $1,934 | $129,805 | $0 | $0 |
| 2015 | $1,581 | $129,805 | $0 | $0 |
| 2014 | $1,547 | $129,530 | $0 | $0 |
| 2013 | -- | $129,530 | $0 | $0 |
Source: Public Records
Map
Nearby Homes
Your Personal Tour Guide
Ask me questions while you tour the home.