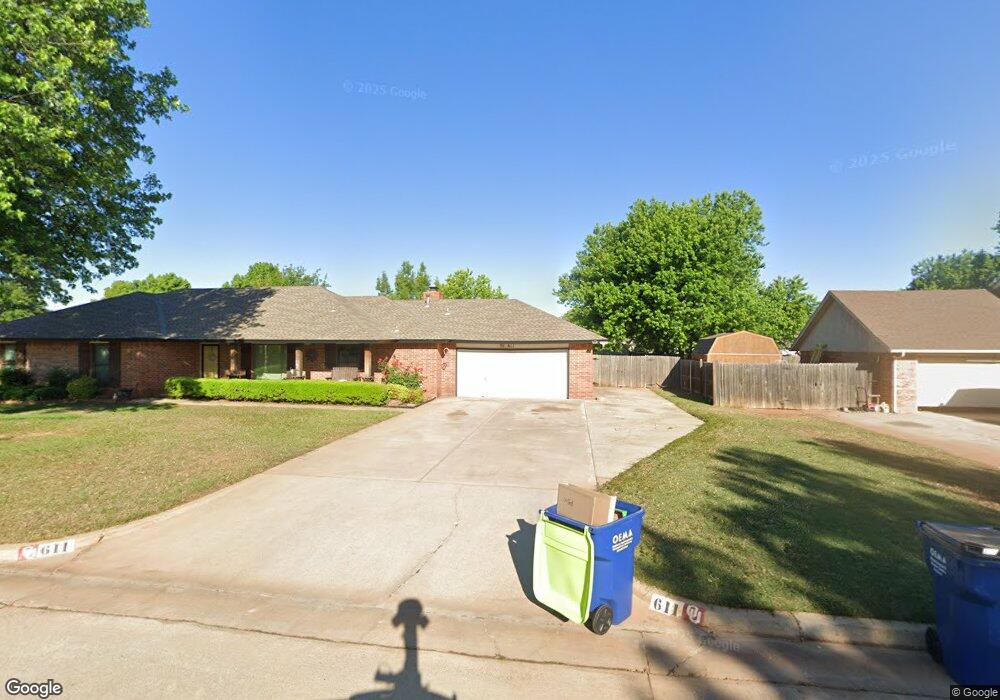
611 N Cardinal Way Mustang, OK 73064
Estimated Value: $283,498 - $316,000
4
Beds
3
Baths
2,062
Sq Ft
$145/Sq Ft
Est. Value
About This Home
This home is located at 611 N Cardinal Way, Mustang, OK 73064 and is currently estimated at $299,125, approximately $145 per square foot. 611 N Cardinal Way is a home located in Canadian County with nearby schools including Mustang Lakehoma Elementary School, Mustang Horizon Intermediate School, and Mustang Middle School.
Ownership History
Date
Name
Owned For
Owner Type
Purchase Details
Closed on
Aug 28, 2008
Sold by
Trotter Kelly R
Bought by
Trotter Russell and Trotter Kelly R
Current Estimated Value
Home Financials for this Owner
Home Financials are based on the most recent Mortgage that was taken out on this home.
Original Mortgage
$158,137
Outstanding Balance
$105,885
Interest Rate
6.66%
Estimated Equity
$193,240
Purchase Details
Closed on
Jul 13, 2006
Sold by
Martinez Felipe and Martinez Nikki
Bought by
Trotter Kelly R
Home Financials for this Owner
Home Financials are based on the most recent Mortgage that was taken out on this home.
Original Mortgage
$110,400
Interest Rate
8.6%
Mortgage Type
Adjustable Rate Mortgage/ARM
Purchase Details
Closed on
Dec 2, 2002
Sold by
Nowlin Chris J and Nowlin April L
Purchase Details
Closed on
Jun 30, 1995
Sold by
Schramm David M and Schramm Janet
Create a Home Valuation Report for This Property
The Home Valuation Report is an in-depth analysis detailing your home's value as well as a comparison with similar homes in the area
Home Values in the Area
Average Home Value in this Area
Purchase History
| Date | Buyer | Sale Price | Title Company |
|---|---|---|---|
| Trotter Russell | -- | Transcontinental Title | |
| Trotter Kelly R | -- | None Available | |
| -- | $136,000 | -- | |
| -- | $85,000 | -- |
Source: Public Records
Mortgage History
| Date | Status | Borrower | Loan Amount |
|---|---|---|---|
| Open | Trotter Russell | $158,137 | |
| Previous Owner | Trotter Kelly R | $110,400 |
Source: Public Records
Tax History Compared to Growth
Tax History
| Year | Tax Paid | Tax Assessment Tax Assessment Total Assessment is a certain percentage of the fair market value that is determined by local assessors to be the total taxable value of land and additions on the property. | Land | Improvement |
|---|---|---|---|---|
| 2024 | $2,130 | $22,413 | $2,640 | $19,773 |
| 2023 | $2,130 | $21,346 | $2,640 | $18,706 |
| 2022 | $2,053 | $20,329 | $2,640 | $17,689 |
| 2021 | $1,987 | $19,597 | $2,640 | $16,957 |
| 2020 | $1,999 | $19,597 | $2,640 | $16,957 |
| 2019 | $1,976 | $19,370 | $2,640 | $16,730 |
| 2018 | $1,923 | $18,448 | $2,640 | $15,808 |
| 2017 | $1,924 | $18,672 | $2,640 | $16,032 |
| 2016 | $1,877 | $18,395 | $2,640 | $15,755 |
| 2015 | $1,759 | $17,310 | $2,640 | $14,670 |
| 2014 | $1,759 | $16,937 | $1,920 | $15,017 |
Source: Public Records
Map
Nearby Homes
- 609 N Centennial Way
- 400 N Amethyst Way
- 401 N Topaz Way
- 513 N Shannon Way
- 913 N Centennial Way
- 309 N Topaz Way
- 1316 W Harvard Way
- 1308 W Harvard Way
- 320 N Jasper Way
- 1401 W Harvard Way
- 1425 W Harvard Way
- 313 N Shannon Way
- 821 N Clear Springs Way
- 1208 W Flowering Peach Way
- 612 N White Tail Way
- 608 N White Tail Way
- 708 N White Tail Way
- 4213 Moonlight Rd
- 4408 Moonlight Rd
- 1721 W Antler Way
- 619 N Cardinal Way
- 610 N Cardinal Way
- 533 N Cardinal Way
- 618 N Cardinal Way
- 709 N Cardinal Way
- 530 N Cardinal Way
- 525 N Cardinal Way
- 708 N Cardinal Way
- 624 N Centennial Way
- 615 N Mockingbird Way
- 616 N Centennial Way
- 717 N Cardinal Way
- 708 N Centennial Way
- 525 N Mockingbird Way
- 608 N Centennial Way
- 701 N Mockingbird Way
- 1417 W Whippoorwill Way
- 716 N Centennial Way
- 1433 W Whippoorwill Way
- 716 N Cardinal Way