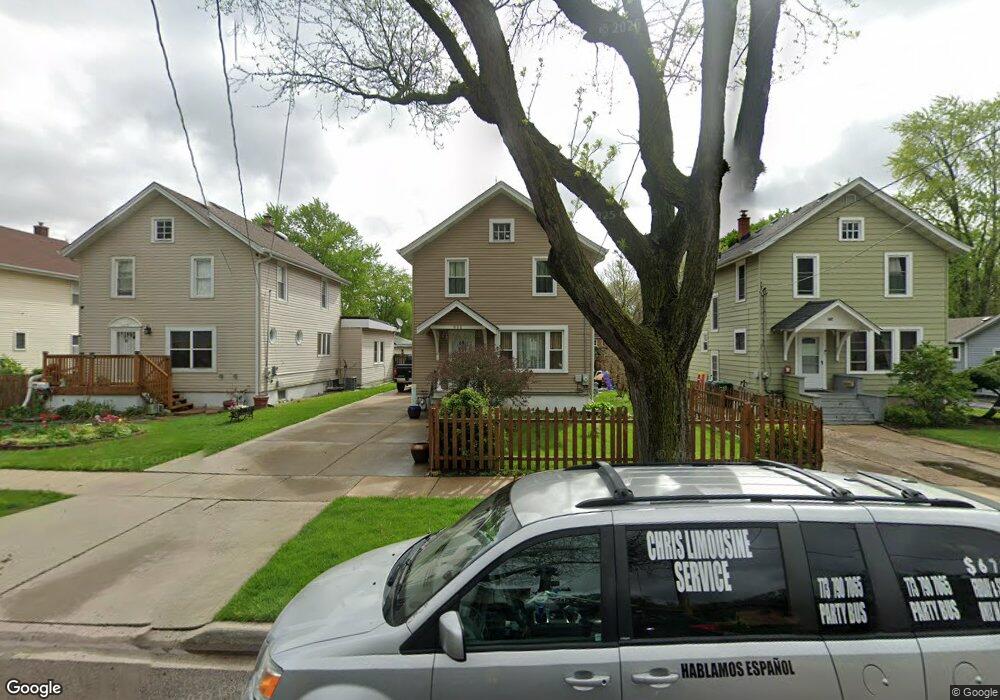
611 N May St Aurora, IL 60506
Near West Galena NeighborhoodEstimated Value: $198,328 - $267,000
3
Beds
1
Bath
1,144
Sq Ft
$209/Sq Ft
Est. Value
About This Home
This home is located at 611 N May St, Aurora, IL 60506 and is currently estimated at $239,082, approximately $208 per square foot. 611 N May St is a home located in Kane County with nearby schools including Hill Elementary School, Herget Middle School, and West Aurora High School.
Create a Home Valuation Report for This Property
The Home Valuation Report is an in-depth analysis detailing your home's value as well as a comparison with similar homes in the area
Home Values in the Area
Average Home Value in this Area
Tax History
| Year | Tax Paid | Tax Assessment Tax Assessment Total Assessment is a certain percentage of the fair market value that is determined by local assessors to be the total taxable value of land and additions on the property. | Land | Improvement |
|---|---|---|---|---|
| 2024 | $2,635 | $49,284 | $7,955 | $41,329 |
| 2023 | $2,369 | $43,656 | $7,108 | $36,548 |
| 2022 | $2,552 | $39,832 | $6,485 | $33,347 |
| 2021 | $2,383 | $37,084 | $6,038 | $31,046 |
| 2020 | $1,771 | $34,445 | $5,608 | $28,837 |
| 2019 | $2,045 | $31,914 | $5,196 | $26,718 |
| 2018 | $2,122 | $29,252 | $4,806 | $24,446 |
| 2017 | $1,777 | $25,269 | $4,428 | $20,841 |
| 2016 | $1,685 | $21,860 | $3,796 | $18,064 |
| 2015 | -- | $18,477 | $3,264 | $15,213 |
| 2014 | -- | $17,771 | $3,140 | $14,631 |
| 2013 | -- | $22,325 | $3,095 | $19,230 |
Source: Public Records
Map
Nearby Homes
- 603 N May St
- 519 N View St
- 418 W Illinois Ave
- 507 W Park Ave
- 415 Blackhawk St
- 371 Cedar St
- 109 N May St
- 355 Lawndale Ave
- 932 W New York St
- 424 N Lancaster Ave
- 20-22 N Locust St
- 359 W Galena Blvd
- 837 Taylor Ave
- 659 W Downer Place
- 231-233 Williams St
- 450 W Downer Place Unit 4C
- 847 Foran Ln
- 810 W Galena Blvd
- 509 N Park Ave
- 1060 N Highland Ave
Your Personal Tour Guide
Ask me questions while you tour the home.