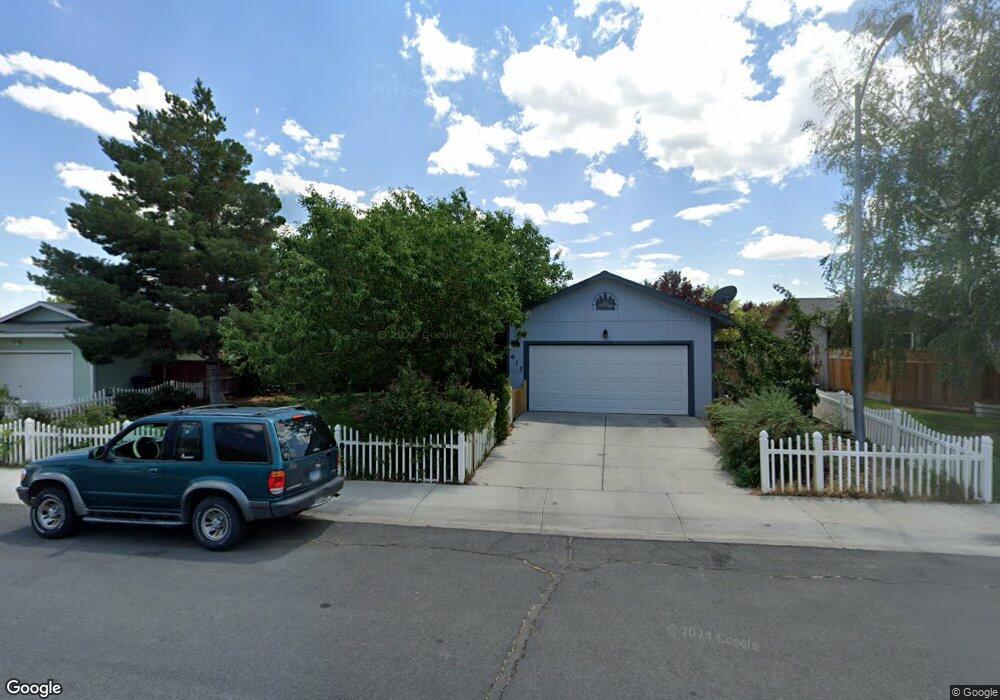
611 Nader Way Fernley, NV 89408
Estimated Value: $330,963 - $351,000
2
Beds
2
Baths
1,180
Sq Ft
$290/Sq Ft
Est. Value
About This Home
This home is located at 611 Nader Way, Fernley, NV 89408 and is currently estimated at $342,491, approximately $290 per square foot. 611 Nader Way is a home located in Lyon County with nearby schools including Cottonwood Elementary School, Fernley Intermediate School, and Fernley High School.
Ownership History
Date
Name
Owned For
Owner Type
Purchase Details
Closed on
Sep 4, 2008
Sold by
Dizon Consuelo D
Bought by
Page Michael D and Page Wendy J
Current Estimated Value
Home Financials for this Owner
Home Financials are based on the most recent Mortgage that was taken out on this home.
Original Mortgage
$160,000
Outstanding Balance
$106,320
Interest Rate
6.5%
Mortgage Type
VA
Estimated Equity
$236,171
Purchase Details
Closed on
Jun 1, 2006
Sold by
Dizon Consuelo D
Bought by
Dizon Consuelo D and Dizon Family Trust
Create a Home Valuation Report for This Property
The Home Valuation Report is an in-depth analysis detailing your home's value as well as a comparison with similar homes in the area
Home Values in the Area
Average Home Value in this Area
Purchase History
| Date | Buyer | Sale Price | Title Company |
|---|---|---|---|
| Page Michael D | $160,000 | First Centennial Title Co Nv | |
| Dizon Consuelo D | -- | None Available |
Source: Public Records
Mortgage History
| Date | Status | Borrower | Loan Amount |
|---|---|---|---|
| Open | Page Michael D | $160,000 |
Source: Public Records
Tax History Compared to Growth
Tax History
| Year | Tax Paid | Tax Assessment Tax Assessment Total Assessment is a certain percentage of the fair market value that is determined by local assessors to be the total taxable value of land and additions on the property. | Land | Improvement |
|---|---|---|---|---|
| 2025 | $1,254 | $94,097 | $49,000 | $45,097 |
| 2024 | $1,627 | $94,500 | $49,000 | $45,499 |
| 2023 | $1,627 | $91,678 | $49,000 | $42,678 |
| 2022 | $1,537 | $88,398 | $49,000 | $39,398 |
| 2021 | $1,529 | $83,976 | $45,500 | $38,476 |
| 2020 | $1,491 | $66,690 | $29,750 | $36,940 |
| 2019 | $1,476 | $65,416 | $29,750 | $35,666 |
| 2018 | $1,065 | $59,354 | $24,500 | $34,854 |
| 2017 | $1,076 | $52,395 | $17,500 | $34,895 |
| 2016 | $911 | $39,699 | $5,780 | $33,919 |
| 2015 | $946 | $30,536 | $5,780 | $24,756 |
| 2014 | $952 | $26,559 | $5,780 | $20,779 |
Source: Public Records
Map
Nearby Homes