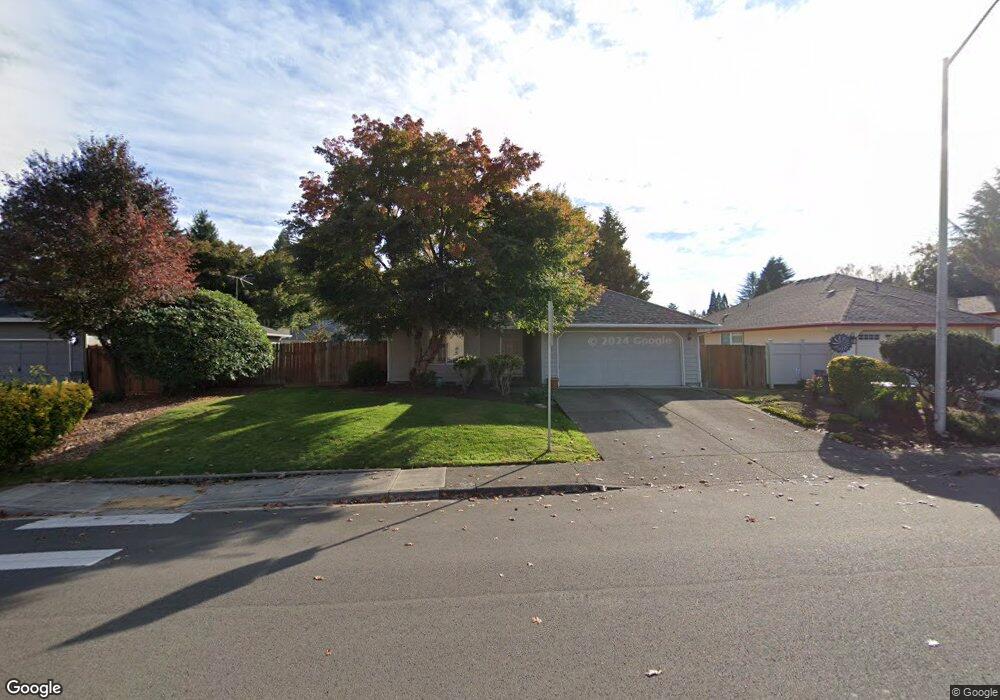
611 NE 112th St Vancouver, WA 98685
Estimated Value: $514,075 - $560,000
3
Beds
2
Baths
1,750
Sq Ft
$304/Sq Ft
Est. Value
About This Home
This home is located at 611 NE 112th St, Vancouver, WA 98685 and is currently estimated at $532,269, approximately $304 per square foot. 611 NE 112th St is a home located in Clark County with nearby schools including Sacajawea Elementary School, Jefferson Middle School, and Columbia River High School.
Ownership History
Date
Name
Owned For
Owner Type
Purchase Details
Closed on
Oct 10, 2008
Sold by
Erickson Brandon W and Erickson Sharon S
Bought by
Anderson Kathleen S
Current Estimated Value
Home Financials for this Owner
Home Financials are based on the most recent Mortgage that was taken out on this home.
Original Mortgage
$125,000
Outstanding Balance
$82,642
Interest Rate
6.31%
Mortgage Type
Purchase Money Mortgage
Estimated Equity
$449,627
Purchase Details
Closed on
Nov 19, 1997
Sold by
Schram Paul D
Bought by
Erickson Brandon W and Erickson Sharon S
Home Financials for this Owner
Home Financials are based on the most recent Mortgage that was taken out on this home.
Original Mortgage
$111,200
Interest Rate
7.33%
Mortgage Type
Balloon
Purchase Details
Closed on
Jan 1, 1995
Sold by
Tweedy Kirk C and Tweedy Shauna C
Bought by
Schram Paul D
Home Financials for this Owner
Home Financials are based on the most recent Mortgage that was taken out on this home.
Original Mortgage
$131,550
Interest Rate
9.29%
Create a Home Valuation Report for This Property
The Home Valuation Report is an in-depth analysis detailing your home's value as well as a comparison with similar homes in the area
Home Values in the Area
Average Home Value in this Area
Purchase History
| Date | Buyer | Sale Price | Title Company |
|---|---|---|---|
| Anderson Kathleen S | $245,000 | Fidelity National Title | |
| Erickson Brandon W | $139,000 | Transnation Title Insurance | |
| Schram Paul D | $138,500 | First American Title |
Source: Public Records
Mortgage History
| Date | Status | Borrower | Loan Amount |
|---|---|---|---|
| Open | Anderson Kathleen S | $125,000 | |
| Previous Owner | Erickson Brandon W | $111,200 | |
| Previous Owner | Schram Paul D | $131,550 |
Source: Public Records
Tax History Compared to Growth
Tax History
| Year | Tax Paid | Tax Assessment Tax Assessment Total Assessment is a certain percentage of the fair market value that is determined by local assessors to be the total taxable value of land and additions on the property. | Land | Improvement |
|---|---|---|---|---|
| 2025 | $4,649 | $455,912 | $180,000 | $275,912 |
| 2024 | $4,294 | $439,038 | $180,000 | $259,038 |
| 2023 | $4,315 | $446,285 | $168,750 | $277,535 |
| 2022 | $4,180 | $437,578 | $211,500 | $226,078 |
| 2021 | $4,016 | $377,570 | $163,625 | $213,945 |
| 2020 | $3,635 | $340,407 | $148,750 | $191,657 |
| 2019 | $3,384 | $327,170 | $149,625 | $177,545 |
| 2018 | $3,496 | $314,826 | $0 | $0 |
| 2017 | $3,061 | $271,731 | $0 | $0 |
| 2016 | $2,872 | $246,919 | $0 | $0 |
| 2015 | $2,850 | $216,382 | $0 | $0 |
| 2014 | -- | $207,268 | $0 | $0 |
| 2013 | -- | $183,296 | $0 | $0 |
Source: Public Records
Map
Nearby Homes
- 405 NE 115th Cir
- 701 NE 117th St
- 1211 NE 110th St
- 208 NE 106th St
- 1110 NE 115th St
- 211 NE 117th St
- 317 NE Bassel Rd
- 405 NE 105th St
- 420 NE 103rd St
- 421 NE 105th St Unit 421
- 316 NE Bassel Rd
- 11620 NW 2nd Ct
- 415 NW 117th St
- 1611 NE 113th St Unit 421
- 1611 NE 113th St
- 1621 NE 113th St Unit 132
- 322 NW 103rd St
- 10601 NW 7th Ave
- 10707 NW 7th Ave
- 11302 NW 7th Ave
- 605 NE 112th St
- 617 NE 112th St
- 11116 NE 6th Ct
- 11112 NE 6th Ct
- 601 NE 112th St
- 11118 NE 6th Ct
- 11106 NE 6th Ct
- 516 NE 111th St
- 709 NE 112th St
- 11119 NE 6th Ct
- 11101 NE 5th Ave
- 11113 NE 6th Ct
- 512 NE 111th St
- 11115 NE 6th Ct
- 11117 NE 6th Ct
- 11010 NE 8th Ave
- 11003 NE 6th Ave
- 11012 NE 6th Ave
- 11004 NE 8th Ave
- 800 NE 112th St