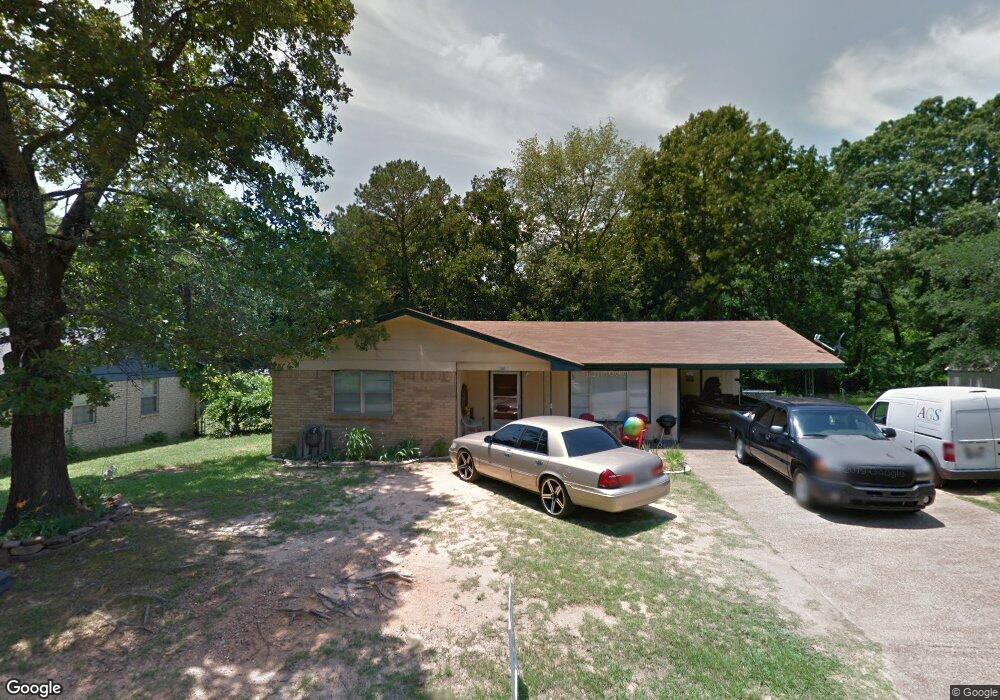
611 NE D St Antlers, OK 74523
Estimated Value: $120,749 - $144,000
3
Beds
1
Bath
1,416
Sq Ft
$94/Sq Ft
Est. Value
About This Home
This home is located at 611 NE D St, Antlers, OK 74523 and is currently estimated at $132,937, approximately $93 per square foot. 611 NE D St is a home located in Pushmataha County with nearby schools including Brantly Elementary School, Obuch Middle School, and Antlers High School.
Ownership History
Date
Name
Owned For
Owner Type
Purchase Details
Closed on
May 24, 2019
Sold by
Bartlett Craig J and Bartlett Cherry J
Bought by
Renteria Matthew
Current Estimated Value
Home Financials for this Owner
Home Financials are based on the most recent Mortgage that was taken out on this home.
Original Mortgage
$89,294
Outstanding Balance
$78,348
Interest Rate
4.1%
Mortgage Type
Construction
Estimated Equity
$54,589
Purchase Details
Closed on
Jun 20, 2013
Sold by
Bartlett Craig
Bought by
Bartlett Craig
Purchase Details
Closed on
Feb 27, 2003
Sold by
Rust Vicki
Bought by
Bartlett Craig
Purchase Details
Closed on
Jan 24, 2002
Sold by
Wolfe Jack E
Bought by
Rust Vicki
Purchase Details
Closed on
Nov 3, 1999
Sold by
Wilson Clifton
Bought by
Wolfe Jack E
Create a Home Valuation Report for This Property
The Home Valuation Report is an in-depth analysis detailing your home's value as well as a comparison with similar homes in the area
Home Values in the Area
Average Home Value in this Area
Purchase History
| Date | Buyer | Sale Price | Title Company |
|---|---|---|---|
| Renteria Matthew | $90,000 | -- | |
| Bartlett Craig | -- | -- | |
| Bartlett Craig | $44,500 | -- | |
| Rust Vicki | $27,000 | -- | |
| Wolfe Jack E | $32,000 | -- |
Source: Public Records
Mortgage History
| Date | Status | Borrower | Loan Amount |
|---|---|---|---|
| Open | Renteria Matthew | $89,294 |
Source: Public Records
Tax History Compared to Growth
Tax History
| Year | Tax Paid | Tax Assessment Tax Assessment Total Assessment is a certain percentage of the fair market value that is determined by local assessors to be the total taxable value of land and additions on the property. | Land | Improvement |
|---|---|---|---|---|
| 2025 | $842 | $11,460 | $660 | $10,800 |
| 2024 | $842 | $11,460 | $660 | $10,800 |
| 2023 | $764 | $10,395 | $660 | $9,735 |
| 2022 | $727 | $9,900 | $660 | $9,240 |
| 2021 | $728 | $9,900 | $660 | $9,240 |
| 2020 | $728 | $9,900 | $660 | $9,240 |
| 2019 | $444 | $6,039 | $660 | $5,379 |
| 2018 | $365 | $4,963 | $660 | $4,303 |
| 2017 | $375 | $5,103 | $660 | $4,443 |
| 2016 | $359 | $4,885 | $660 | $4,225 |
| 2015 | $342 | $4,653 | $660 | $3,993 |
| 2014 | $360 | $4,895 | $321 | $4,574 |
Source: Public Records
Map
Nearby Homes