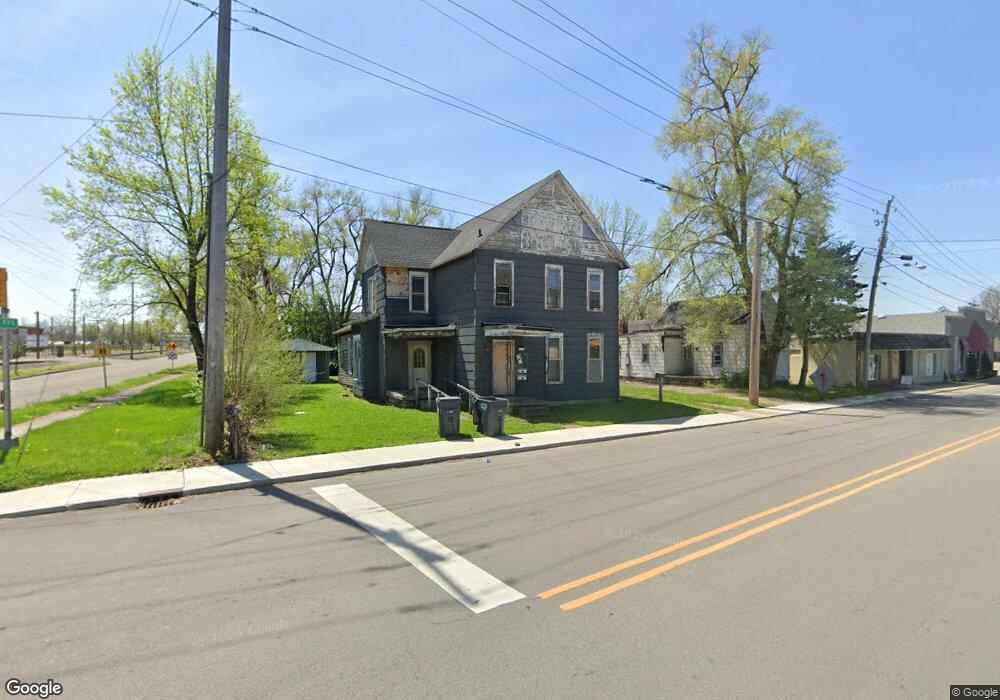
611 Nichol Ave Anderson, IN 46016
Estimated Value: $67,000 - $144,000
4
Beds
3
Baths
1,776
Sq Ft
$59/Sq Ft
Est. Value
About This Home
This home is located at 611 Nichol Ave, Anderson, IN 46016 and is currently estimated at $105,500, approximately $59 per square foot. 611 Nichol Ave is a home located in Madison County with nearby schools including Tenth Street Elementary School, Highland Middle School, and Anderson High School.
Ownership History
Date
Name
Owned For
Owner Type
Purchase Details
Closed on
Aug 13, 2024
Sold by
Anderson Kreg Zachary and Anderson Sherry E
Bought by
Alc Property Management Llc
Current Estimated Value
Purchase Details
Closed on
Aug 24, 2009
Sold by
Inidiana Luxury Homes Inc
Bought by
Anderson Kreg Zachary and Anderson Sherry E
Purchase Details
Closed on
May 19, 2009
Sold by
Deutsche Bank National Trust Co
Bought by
Indiana Luxury Homes Inc and Coachs Corner Enterprises Inc
Purchase Details
Closed on
Aug 15, 2008
Sold by
Brown William T and State Of Indina
Bought by
Deutsche Bank National Trust Co
Purchase Details
Closed on
Dec 12, 2005
Sold by
Blackburn Theodore J
Bought by
Brown William T
Home Financials for this Owner
Home Financials are based on the most recent Mortgage that was taken out on this home.
Original Mortgage
$21,294
Interest Rate
11.45%
Mortgage Type
Adjustable Rate Mortgage/ARM
Create a Home Valuation Report for This Property
The Home Valuation Report is an in-depth analysis detailing your home's value as well as a comparison with similar homes in the area
Home Values in the Area
Average Home Value in this Area
Purchase History
| Date | Buyer | Sale Price | Title Company |
|---|---|---|---|
| Alc Property Management Llc | -- | None Listed On Document | |
| Anderson Kreg Zachary | -- | -- | |
| Indiana Luxury Homes Inc | -- | -- | |
| Deutsche Bank National Trust Co | $18,000 | -- | |
| Brown William T | -- | -- |
Source: Public Records
Mortgage History
| Date | Status | Borrower | Loan Amount |
|---|---|---|---|
| Previous Owner | Brown William T | $21,294 |
Source: Public Records
Tax History Compared to Growth
Tax History
| Year | Tax Paid | Tax Assessment Tax Assessment Total Assessment is a certain percentage of the fair market value that is determined by local assessors to be the total taxable value of land and additions on the property. | Land | Improvement |
|---|---|---|---|---|
| 2024 | $849 | $38,200 | $9,900 | $28,300 |
| 2023 | $668 | $38,200 | $9,900 | $28,300 |
| 2022 | $675 | $38,600 | $9,500 | $29,100 |
| 2021 | $629 | $36,000 | $9,400 | $26,600 |
| 2020 | $603 | $34,400 | $8,900 | $25,500 |
| 2019 | $867 | $32,800 | $8,900 | $23,900 |
| 2018 | $838 | $30,700 | $8,900 | $21,800 |
| 2017 | $470 | $30,400 | $8,900 | $21,500 |
| 2016 | $727 | $30,500 | $8,900 | $21,600 |
| 2014 | $462 | $29,900 | $8,800 | $21,100 |
| 2013 | $462 | $29,900 | $8,800 | $21,100 |
Source: Public Records
Map
Nearby Homes