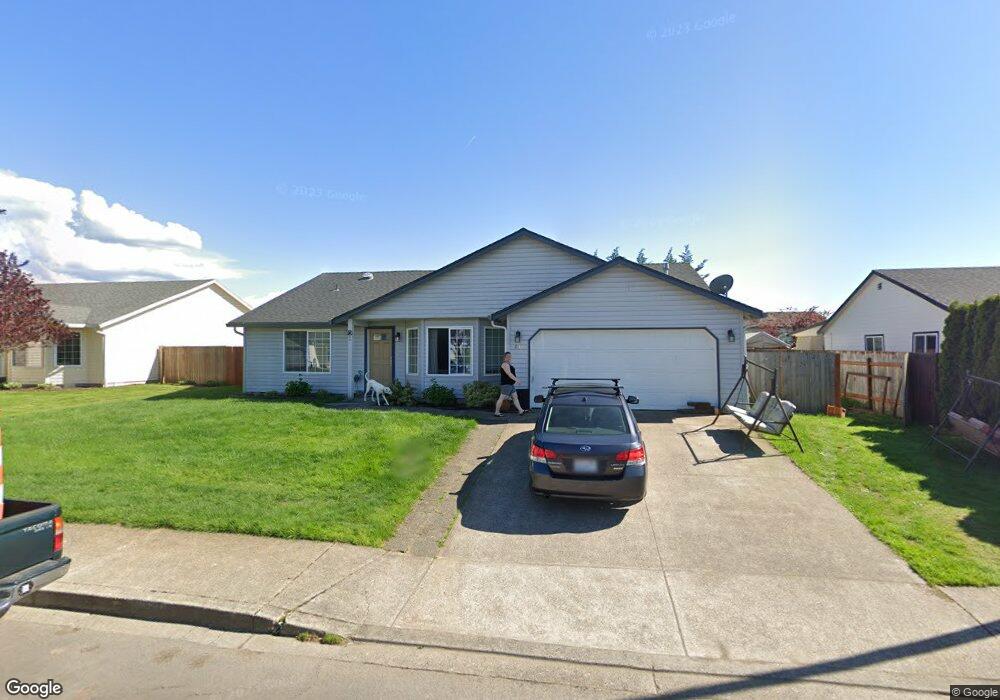
611 NW 23rd St Battle Ground, WA 98604
Estimated Value: $529,871 - $582,000
4
Beds
3
Baths
1,867
Sq Ft
$294/Sq Ft
Est. Value
About This Home
This home is located at 611 NW 23rd St, Battle Ground, WA 98604 and is currently estimated at $548,968, approximately $294 per square foot. 611 NW 23rd St is a home located in Clark County with nearby schools including Captain Strong Primary School, Chief Umtuch Middle School, and Battle Ground High School.
Ownership History
Date
Name
Owned For
Owner Type
Purchase Details
Closed on
Apr 10, 2013
Sold by
Hite Ryan
Bought by
Hite Theresa A and Collyer Theresa A
Current Estimated Value
Purchase Details
Closed on
Oct 5, 2007
Sold by
Collyer Theresa A
Bought by
Collyer Theresa A and Hite Ryan
Home Financials for this Owner
Home Financials are based on the most recent Mortgage that was taken out on this home.
Original Mortgage
$252,875
Outstanding Balance
$150,847
Interest Rate
6.4%
Mortgage Type
New Conventional
Estimated Equity
$398,121
Purchase Details
Closed on
Feb 18, 2005
Sold by
Collyer Matthew J
Bought by
Collyer Theresa A
Purchase Details
Closed on
Jun 27, 2001
Sold by
Tucker Stephan E
Bought by
Collyer Matthew J and Collyer Theresa A
Purchase Details
Closed on
Oct 26, 1999
Sold by
Seppala Homes Inc
Bought by
Tucker Stephan E
Home Financials for this Owner
Home Financials are based on the most recent Mortgage that was taken out on this home.
Original Mortgage
$104,150
Interest Rate
7.82%
Create a Home Valuation Report for This Property
The Home Valuation Report is an in-depth analysis detailing your home's value as well as a comparison with similar homes in the area
Home Values in the Area
Average Home Value in this Area
Purchase History
| Date | Buyer | Sale Price | Title Company |
|---|---|---|---|
| Hite Theresa A | -- | None Available | |
| Collyer Theresa A | -- | Lsi | |
| Collyer Theresa A | -- | None Available | |
| Collyer Matthew J | -- | Charter Title Corporation | |
| Tucker Stephan E | $144,150 | Washington Title Company |
Source: Public Records
Mortgage History
| Date | Status | Borrower | Loan Amount |
|---|---|---|---|
| Open | Collyer Theresa A | $252,875 | |
| Previous Owner | Tucker Stephan E | $104,150 |
Source: Public Records
Tax History Compared to Growth
Tax History
| Year | Tax Paid | Tax Assessment Tax Assessment Total Assessment is a certain percentage of the fair market value that is determined by local assessors to be the total taxable value of land and additions on the property. | Land | Improvement |
|---|---|---|---|---|
| 2025 | $3,744 | $457,054 | $155,000 | $302,054 |
| 2024 | $3,353 | $459,088 | $155,000 | $304,088 |
| 2023 | $3,481 | $467,846 | $155,000 | $312,846 |
| 2022 | $3,466 | $442,811 | $123,250 | $319,561 |
| 2021 | $3,400 | $383,190 | $106,250 | $276,940 |
| 2020 | $2,886 | $344,692 | $97,750 | $246,942 |
| 2019 | $2,398 | $331,558 | $100,300 | $231,258 |
| 2018 | $2,911 | $322,381 | $0 | $0 |
| 2017 | $2,460 | $287,537 | $0 | $0 |
| 2016 | $2,420 | $264,528 | $0 | $0 |
| 2015 | $2,361 | $238,777 | $0 | $0 |
| 2014 | -- | $221,092 | $0 | $0 |
| 2013 | -- | $198,501 | $0 | $0 |
Source: Public Records
Map
Nearby Homes
- 706 NW 23rd St
- 1904 NW 21st Cir
- 1908 NW 21st Cir
- 617 NW 21st St
- 2661 NW 9th Place
- 110 NW 24th St
- 2804 NW 8th Ave
- 642 NW 28th St
- 650 NW 28th St
- 734 NW 28th St
- 634 NW 28th St
- 742 NW 28th St
- 2812 NW 8th Ave
- 16 NW 23rd St
- 2801 NW 8th Ave
- 18 NW 24th St
- 2820 NW 8th Ave
- 2809 NW 8th Ave
- 653 NW 29th St
- 637 NW 29th St