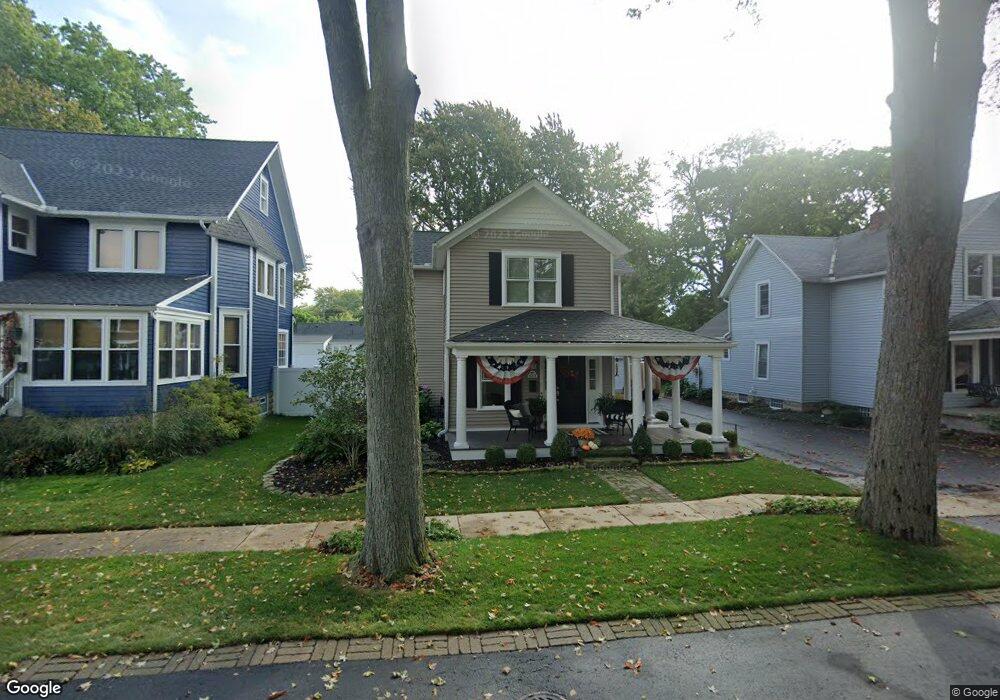
611 Perry St Vermilion, OH 44089
Estimated Value: $237,000 - $476,000
3
Beds
2
Baths
1,440
Sq Ft
$211/Sq Ft
Est. Value
About This Home
This home is located at 611 Perry St, Vermilion, OH 44089 and is currently estimated at $304,236, approximately $211 per square foot. 611 Perry St is a home located in Erie County with nearby schools including Vermilion Elementary School, Sailorway Middle School, and Vermilion High School.
Ownership History
Date
Name
Owned For
Owner Type
Purchase Details
Closed on
Mar 11, 2010
Sold by
Federal Home Loan Mortgage Corporation
Bought by
Gigliotti Richard M and Gigliotti Lynn M
Current Estimated Value
Purchase Details
Closed on
Nov 6, 2009
Sold by
Scheiferstein Gregorey G
Bought by
Federal Home Loan Mortgage Corporation
Purchase Details
Closed on
Jan 2, 1998
Sold by
Sheehe Elizabeth
Bought by
Scheiferstein Gregory
Home Financials for this Owner
Home Financials are based on the most recent Mortgage that was taken out on this home.
Original Mortgage
$99,750
Interest Rate
7.28%
Mortgage Type
New Conventional
Purchase Details
Closed on
Jun 3, 1996
Sold by
Knight Charles L
Bought by
Sheehe Elizabeth A
Home Financials for this Owner
Home Financials are based on the most recent Mortgage that was taken out on this home.
Original Mortgage
$60,000
Interest Rate
8.13%
Mortgage Type
New Conventional
Create a Home Valuation Report for This Property
The Home Valuation Report is an in-depth analysis detailing your home's value as well as a comparison with similar homes in the area
Home Values in the Area
Average Home Value in this Area
Purchase History
| Date | Buyer | Sale Price | Title Company |
|---|---|---|---|
| Gigliotti Richard M | $77,500 | None Available | |
| Federal Home Loan Mortgage Corporation | $57,678 | Attorney | |
| Scheiferstein Gregory | $105,000 | -- | |
| Sheehe Elizabeth A | $88,000 | -- |
Source: Public Records
Mortgage History
| Date | Status | Borrower | Loan Amount |
|---|---|---|---|
| Previous Owner | Scheiferstein Gregory | $99,750 | |
| Previous Owner | Sheehe Elizabeth A | $60,000 |
Source: Public Records
Tax History Compared to Growth
Tax History
| Year | Tax Paid | Tax Assessment Tax Assessment Total Assessment is a certain percentage of the fair market value that is determined by local assessors to be the total taxable value of land and additions on the property. | Land | Improvement |
|---|---|---|---|---|
| 2024 | $2,764 | $64,242 | $5,841 | $58,401 |
| 2023 | $2,764 | $54,400 | $5,309 | $49,091 |
| 2022 | $2,547 | $54,403 | $5,309 | $49,094 |
| 2021 | $2,532 | $54,400 | $5,310 | $49,090 |
| 2020 | $2,436 | $51,210 | $5,310 | $45,900 |
| 2019 | $2,525 | $51,210 | $5,310 | $45,900 |
| 2018 | $2,528 | $51,210 | $5,310 | $45,900 |
| 2017 | $2,332 | $46,720 | $5,410 | $41,310 |
| 2016 | $2,318 | $46,720 | $5,410 | $41,310 |
| 2015 | $2,283 | $46,720 | $5,410 | $41,310 |
| 2014 | $2,299 | $46,720 | $5,410 | $41,310 |
| 2013 | $2,269 | $50,890 | $5,410 | $45,480 |
Source: Public Records
Map
Nearby Homes
- 586 Washington St
- 623 Main St
- 629 Main St
- 5572 South St
- 5539 South St
- 880 Exchange St
- 0 Liberty Ave Unit 20252085
- 1106 State St
- 5015 Park Dr
- 5945 Cape Hatteras
- 5939 Cape Hatteras
- 5164 Langfitt St
- Adriatic Plan at Aspire at Lighthouse Estates
- Oleander Plan at Aspire at Lighthouse Estates
- Sweet Pea Plan at Aspire at Lighthouse Estates
- Water Lily Plan at Aspire at Lighthouse Estates
- 5993 Montauk Point
- 6039 Conneaut Light Dr
- 6041 Conneaut Light Dr
- 4618 Compass Rose Unit 20