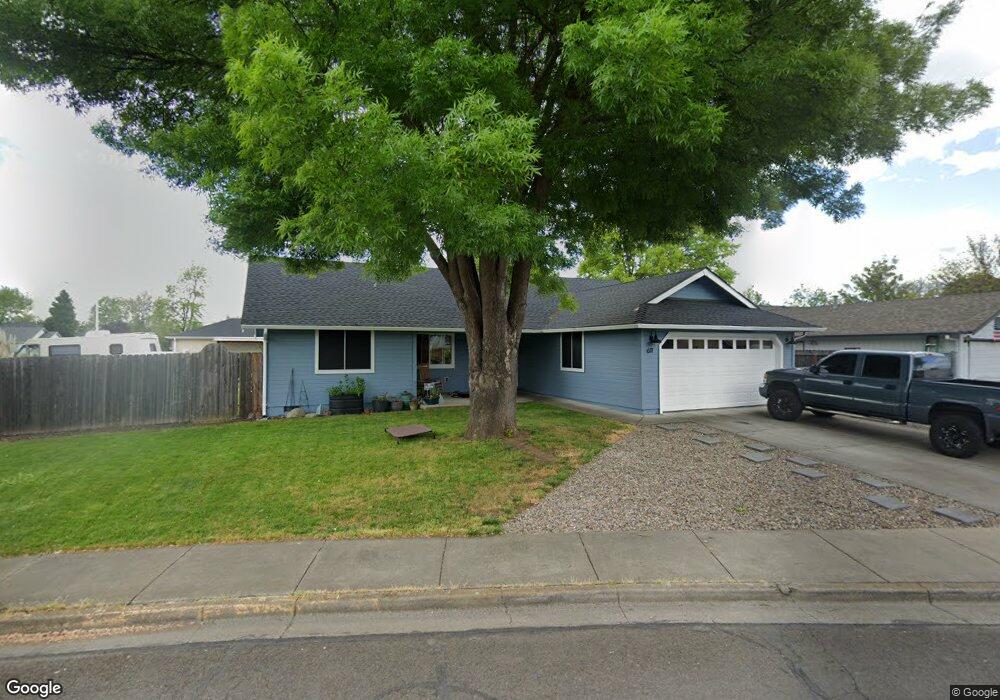
611 Primrose Dr Central Point, OR 97502
Estimated Value: $354,000 - $381,000
3
Beds
2
Baths
1,336
Sq Ft
$274/Sq Ft
Est. Value
About This Home
This home is located at 611 Primrose Dr, Central Point, OR 97502 and is currently estimated at $366,716, approximately $274 per square foot. 611 Primrose Dr is a home located in Jackson County with nearby schools including Central Point Elementary School, Scenic Middle School, and Crater High School.
Ownership History
Date
Name
Owned For
Owner Type
Purchase Details
Closed on
Apr 19, 2010
Sold by
Wallick John M
Bought by
Robinson Kyle and Robinson Keli S
Current Estimated Value
Home Financials for this Owner
Home Financials are based on the most recent Mortgage that was taken out on this home.
Original Mortgage
$166,819
Outstanding Balance
$112,541
Interest Rate
5.5%
Mortgage Type
FHA
Estimated Equity
$254,175
Purchase Details
Closed on
Aug 20, 2009
Sold by
Manninen Daniel and Estate Of Viola G Manninen
Bought by
Wallick John M
Home Financials for this Owner
Home Financials are based on the most recent Mortgage that was taken out on this home.
Original Mortgage
$80,000
Interest Rate
5.17%
Mortgage Type
Purchase Money Mortgage
Purchase Details
Closed on
Feb 8, 1999
Sold by
Manninen Elmer and Manninen Viola
Bought by
Manninen Elmer
Home Financials for this Owner
Home Financials are based on the most recent Mortgage that was taken out on this home.
Original Mortgage
$43,500
Interest Rate
6.79%
Create a Home Valuation Report for This Property
The Home Valuation Report is an in-depth analysis detailing your home's value as well as a comparison with similar homes in the area
Purchase History
| Date | Buyer | Sale Price | Title Company |
|---|---|---|---|
| Robinson Kyle | $169,900 | Amerititle | |
| Wallick John M | $112,000 | Amerititle | |
| Manninen Elmer | -- | Crater Title Insurance |
Source: Public Records
Mortgage History
| Date | Status | Borrower | Loan Amount |
|---|---|---|---|
| Open | Robinson Kyle | $166,819 | |
| Previous Owner | Wallick John M | $80,000 | |
| Previous Owner | Manninen Elmer | $43,500 |
Source: Public Records
Tax History
| Year | Tax Paid | Tax Assessment Tax Assessment Total Assessment is a certain percentage of the fair market value that is determined by local assessors to be the total taxable value of land and additions on the property. | Land | Improvement |
|---|---|---|---|---|
| 2026 | $3,233 | $195,380 | -- | -- |
| 2025 | $3,154 | $189,690 | $62,170 | $127,520 |
| 2024 | $3,154 | $184,170 | $60,360 | $123,810 |
| 2023 | $3,052 | $178,810 | $58,600 | $120,210 |
| 2022 | $2,981 | $178,810 | $58,600 | $120,210 |
| 2021 | $2,896 | $173,610 | $56,890 | $116,720 |
| 2020 | $2,812 | $168,560 | $55,240 | $113,320 |
| 2019 | $2,743 | $158,900 | $52,070 | $106,830 |
| 2018 | $2,659 | $154,280 | $50,550 | $103,730 |
| 2017 | $2,592 | $154,280 | $50,550 | $103,730 |
| 2016 | $2,517 | $145,430 | $47,650 | $97,780 |
| 2015 | $2,411 | $145,430 | $47,650 | $97,780 |
| 2014 | $2,350 | $137,090 | $44,920 | $92,170 |
Source: Public Records
Map
Nearby Homes
- 512 Village Dr Unit B5
- 533 Brittni Ln
- 934 Pittview Ave
- 1025 Fairfield Ave
- 3364 Bursell Rd
- 1204 Heather Ln
- 555 Freeman Rd Unit 73
- 555 Freeman Rd Unit 254
- 555 Freeman Rd Unit 105
- 555 Freeman Rd Unit 209
- 850 Forest Glen Dr
- 301 Freeman Rd Unit 30
- 301 Freeman Rd Unit 92
- 301 Freeman Rd Unit 91
- 301 Freeman Rd Unit 90
- 647 Shadow Way
- 3358 Bursell Rd
- 230 Peninger Rd
- 1258 Joshua Ct
- 959 Westrop Dr
- 651 Primrose Dr
- 902 Hopkins Rd
- 892 Hopkins Rd
- 901 Hopkins 903 Rd
- 906 Hopkins Rd
- 901 Hopkins Rd
- 691 Primrose Dr
- 650 Primrose Dr
- 583 Mountain View Dr
- 909 Juanita Way
- 865 Hopkins Rd
- 874 Hopkins Rd
- 690 Primrose Dr
- 910 Hopkins Rd
- 586 Primrose Dr
- 581 Mountain View Dr
- 911 Juanita Way
- 861 Juanita Way
- 573 Mountain View Dr
- 583 Primrose Dr
Your Personal Tour Guide
Ask me questions while you tour the home.