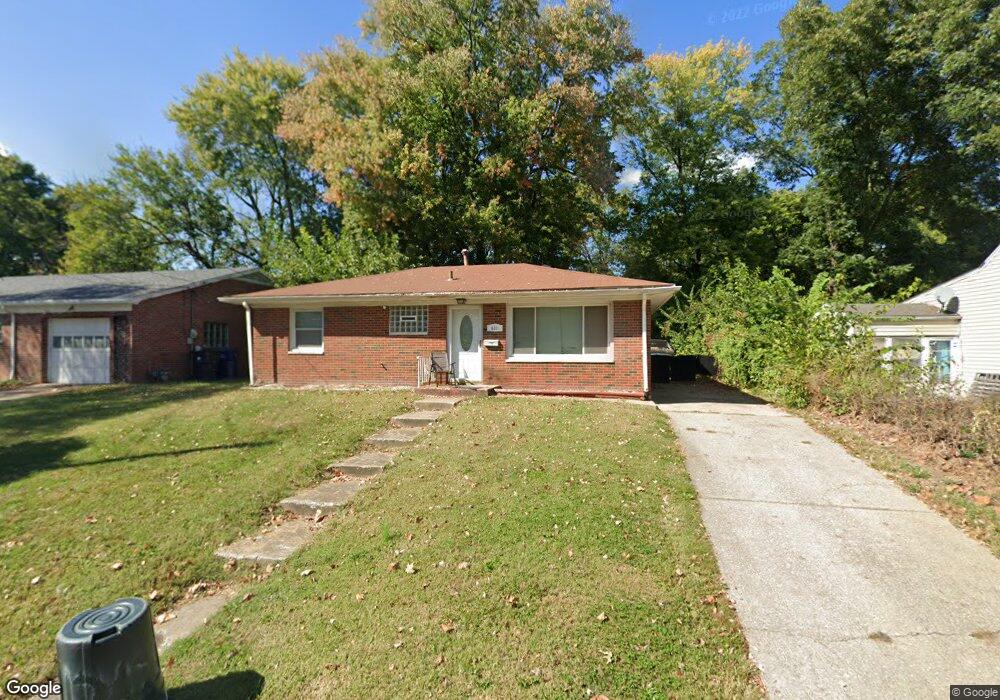
611 S 19th St Belleville, IL 62226
Estimated Value: $123,000 - $139,000
--
Bed
--
Bath
1,215
Sq Ft
$108/Sq Ft
Est. Value
About This Home
This home is located at 611 S 19th St, Belleville, IL 62226 and is currently estimated at $130,684, approximately $107 per square foot. 611 S 19th St is a home located in St. Clair County with nearby schools including Union Elementary School, West Jr High School, and Governor French Academy.
Ownership History
Date
Name
Owned For
Owner Type
Purchase Details
Closed on
Jun 27, 2012
Sold by
Stringer Rasheeda A and Williams Rasheeda A
Bought by
Stringer Kimberly D
Current Estimated Value
Home Financials for this Owner
Home Financials are based on the most recent Mortgage that was taken out on this home.
Original Mortgage
$68,633
Outstanding Balance
$47,734
Interest Rate
3.83%
Mortgage Type
FHA
Estimated Equity
$82,950
Purchase Details
Closed on
Mar 12, 2004
Sold by
Muench Angel L and Ames Patrick
Bought by
Stringer Rasheeda A
Home Financials for this Owner
Home Financials are based on the most recent Mortgage that was taken out on this home.
Original Mortgage
$76,657
Interest Rate
5.78%
Mortgage Type
FHA
Purchase Details
Closed on
Jul 1, 2002
Sold by
Stirewalt Derek J and Stirewalt Cheryl L
Bought by
Muench Angel L and Ames Patrick
Home Financials for this Owner
Home Financials are based on the most recent Mortgage that was taken out on this home.
Original Mortgage
$76,900
Interest Rate
6.7%
Mortgage Type
Purchase Money Mortgage
Create a Home Valuation Report for This Property
The Home Valuation Report is an in-depth analysis detailing your home's value as well as a comparison with similar homes in the area
Home Values in the Area
Average Home Value in this Area
Purchase History
| Date | Buyer | Sale Price | Title Company |
|---|---|---|---|
| Stringer Kimberly D | $70,000 | Metro East Title Corporation | |
| Stringer Rasheeda A | $79,500 | Chicago Title Insurance Co | |
| Muench Angel L | $76,000 | Chicago Title |
Source: Public Records
Mortgage History
| Date | Status | Borrower | Loan Amount |
|---|---|---|---|
| Open | Stringer Kimberly D | $68,633 | |
| Previous Owner | Stringer Rasheeda A | $76,657 | |
| Previous Owner | Muench Angel L | $76,900 |
Source: Public Records
Tax History Compared to Growth
Tax History
| Year | Tax Paid | Tax Assessment Tax Assessment Total Assessment is a certain percentage of the fair market value that is determined by local assessors to be the total taxable value of land and additions on the property. | Land | Improvement |
|---|---|---|---|---|
| 2024 | $2,325 | $32,442 | $3,762 | $28,680 |
| 2023 | $2,106 | $28,434 | $3,689 | $24,745 |
| 2022 | $1,876 | $25,598 | $3,321 | $22,277 |
| 2021 | $1,761 | $23,664 | $3,070 | $20,594 |
| 2020 | $1,686 | $22,378 | $2,903 | $19,475 |
| 2019 | $1,656 | $21,981 | $2,907 | $19,074 |
| 2018 | $1,606 | $21,506 | $2,844 | $18,662 |
| 2017 | $1,594 | $21,355 | $2,824 | $18,531 |
| 2016 | $1,569 | $20,901 | $2,764 | $18,137 |
| 2014 | $1,114 | $18,048 | $2,634 | $15,414 |
| 2013 | $1,561 | $18,306 | $2,672 | $15,634 |
Source: Public Records
Map
Nearby Homes