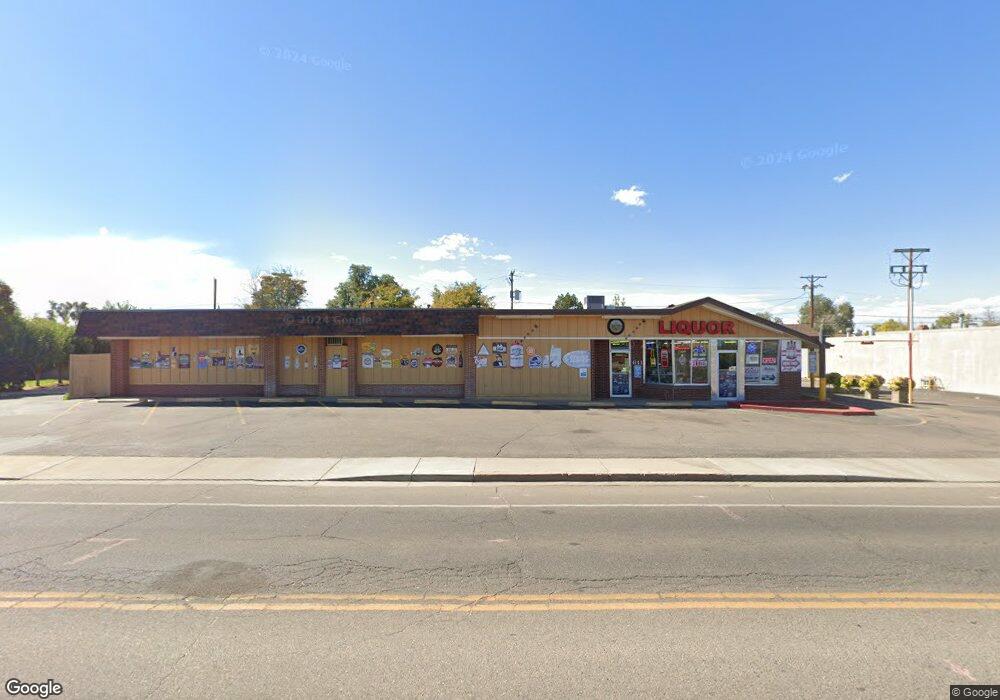
611 S 4th Ave Brighton, CO 80601
Estimated Value: $806,000 - $1,707,093
4
Beds
1
Bath
5,416
Sq Ft
$232/Sq Ft
Est. Value
About This Home
This home is located at 611 S 4th Ave, Brighton, CO 80601 and is currently estimated at $1,256,547, approximately $232 per square foot. 611 S 4th Ave is a home with nearby schools including South Elementary School, Vikan Middle School, and Brighton High School.
Ownership History
Date
Name
Owned For
Owner Type
Purchase Details
Closed on
Apr 17, 2006
Sold by
Village West Investments Inc
Bought by
Choi Jae Wook and Choi Song Sook
Current Estimated Value
Home Financials for this Owner
Home Financials are based on the most recent Mortgage that was taken out on this home.
Original Mortgage
$469,000
Outstanding Balance
$262,876
Interest Rate
6.32%
Mortgage Type
Unknown
Estimated Equity
$993,671
Purchase Details
Closed on
Jun 26, 1998
Sold by
Kang Seok
Bought by
Yeon Kyu San and Yeon Hyun Sook
Purchase Details
Closed on
Jun 17, 1993
Purchase Details
Closed on
Jan 24, 1992
Create a Home Valuation Report for This Property
The Home Valuation Report is an in-depth analysis detailing your home's value as well as a comparison with similar homes in the area
Home Values in the Area
Average Home Value in this Area
Purchase History
| Date | Buyer | Sale Price | Title Company |
|---|---|---|---|
| Choi Jae Wook | $670,000 | Title America | |
| Yeon Kyu San | -- | -- | |
| -- | $565,000 | -- | |
| -- | $2,600,000 | -- |
Source: Public Records
Mortgage History
| Date | Status | Borrower | Loan Amount |
|---|---|---|---|
| Open | Choi Jae Wook | $469,000 |
Source: Public Records
Tax History
| Year | Tax Paid | Tax Assessment Tax Assessment Total Assessment is a certain percentage of the fair market value that is determined by local assessors to be the total taxable value of land and additions on the property. | Land | Improvement |
|---|---|---|---|---|
| 2025 | $9,697 | $101,360 | $38,720 | $62,640 |
| 2024 | $9,697 | $105,140 | $40,840 | $64,300 |
| 2023 | $9,651 | $99,110 | $30,340 | $68,770 |
| 2022 | $9,533 | $86,790 | $32,590 | $54,200 |
| 2021 | $8,760 | $86,790 | $32,590 | $54,200 |
| 2020 | $8,575 | $86,830 | $32,030 | $54,800 |
| 2019 | $8,583 | $86,830 | $32,030 | $54,800 |
| 2018 | $10,893 | $110,160 | $51,930 | $58,230 |
| 2017 | $10,880 | $110,160 | $51,930 | $58,230 |
| 2016 | $9,902 | $99,920 | $47,940 | $51,980 |
| 2015 | $9,881 | $99,920 | $47,940 | $51,980 |
| 2014 | $8,857 | $90,870 | $41,950 | $48,920 |
Source: Public Records
Map
Nearby Homes
- 648 S 3rd Ave
- 617 S 5th Ave
- 784 S 3rd Ave
- 475 S 2nd Ave
- 475 S 2nd Ave Unit Plot 1
- 765 S 1st Ave
- 141 E Bromley Ln
- 303 S 2nd Ave
- 865 S 8th Ave
- 835 S 9th Ave
- 219 S 3rd Ave
- 204 E Egbert St
- 285 S 8th Ave
- 135 S 3rd Ave
- 113 S 4th Ave
- 107 S 4th Ave
- 230 Ash Ave Unit 4
- 792 S 12th Ave
- 362 Dogwood Ave
- 175 S 10th Ave
Your Personal Tour Guide
Ask me questions while you tour the home.