611 Silver St Bridgeport, CT 06610
North Bridgeport NeighborhoodEstimated Value: $374,000 - $419,000
About This Home
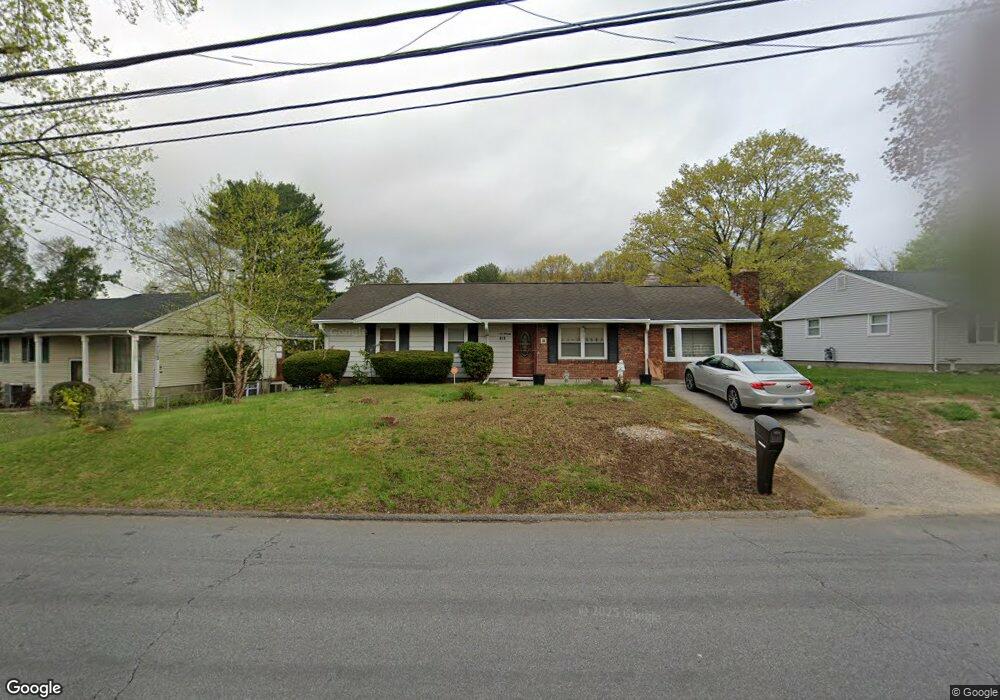
This home is located at 611 Silver St, Bridgeport, CT 06610 and is currently estimated at $399,338, approximately $285 per square foot. 611 Silver St is a home located in Fairfield County with nearby schools including Hooker School, Harding High School, and St Catherine of Siena School.
Ownership History
We collect this data history from publicly available records. To have your information removed, we recommend requesting removal directly through your county’s website.
Purchase Details
Home Financials for this Owner
Home Financials are based on the most recent Mortgage that was taken out on this home.Home Values in the Area
Average Home Value in this Area
Purchase History
We collect this data history from publicly available records. To have your information removed, we recommend requesting removal directly through your county’s website.
| Date | Buyer | Sale Price | Title Company |
|---|---|---|---|
| $100,000 | -- | ||
| $100,000 | -- |
Mortgage History
We collect this data history from publicly available records. To have your information removed, we recommend requesting removal directly through your county’s website.
| Date | Status | Borrower | Loan Amount |
|---|---|---|---|
| Open | $165,483 | ||
| Closed | $138,000 | ||
| Closed | $95,000 |
Tax History
We collect this data history from publicly available records. To have your information removed, we recommend requesting removal directly through your county’s website.
| Year | Tax Paid | Tax Assessment Tax Assessment Total Assessment is a certain percentage of the fair market value that is determined by local assessors to be the total taxable value of land and additions on the property. | Land | Improvement |
|---|---|---|---|---|
| 2025 | $5,605 | $129,000 | $63,500 | $65,500 |
| 2024 | $5,605 | $129,000 | $63,500 | $65,500 |
| 2023 | $5,605 | $129,000 | $63,500 | $65,500 |
| 2022 | $5,605 | $129,000 | $63,500 | $65,500 |
| 2021 | $5,605 | $129,000 | $63,500 | $65,500 |
| 2020 | $6,091 | $112,810 | $56,110 | $56,700 |
| 2019 | $6,091 | $112,810 | $56,110 | $56,700 |
| 2018 | $6,133 | $112,810 | $56,110 | $56,700 |
| 2017 | $6,133 | $112,810 | $56,110 | $56,700 |
| 2016 | $6,133 | $112,810 | $56,110 | $56,700 |
| 2015 | $5,460 | $129,380 | $53,360 | $76,020 |
| 2014 | $5,460 | $129,380 | $53,360 | $76,020 |
Map
- 155 Blueberry Ln
- 75 Masna Place
- 145 Intervale Rd
- 47 Lawlor Terrace
- 9 Round Hill Rd
- 60 Delwood Rd
- 255 Oceanview Terrace
- 315 Seabreeze Dr
- 110 Russell Rd
- 3699 Broadbridge Ave Unit 317
- 3699 Broadbridge Ave Unit 112
- 125 Mcleod Place
- 195 Luanne Rd
- 291 Islandview Rd
- 33 Jerusalem Hill
- 91 Jerusalem Hill
- 34 Hawley Glen Unit 34
- 16 Hawley Glen
- 12 Unity Dr
- 243 White Plains Rd
Ask me questions while you tour the home.