611 Southbrook Dr Tifton, GA 31794
Estimated Value: $138,000 - $250,110
4
Beds
3
Baths
2,280
Sq Ft
$80/Sq Ft
Est. Value
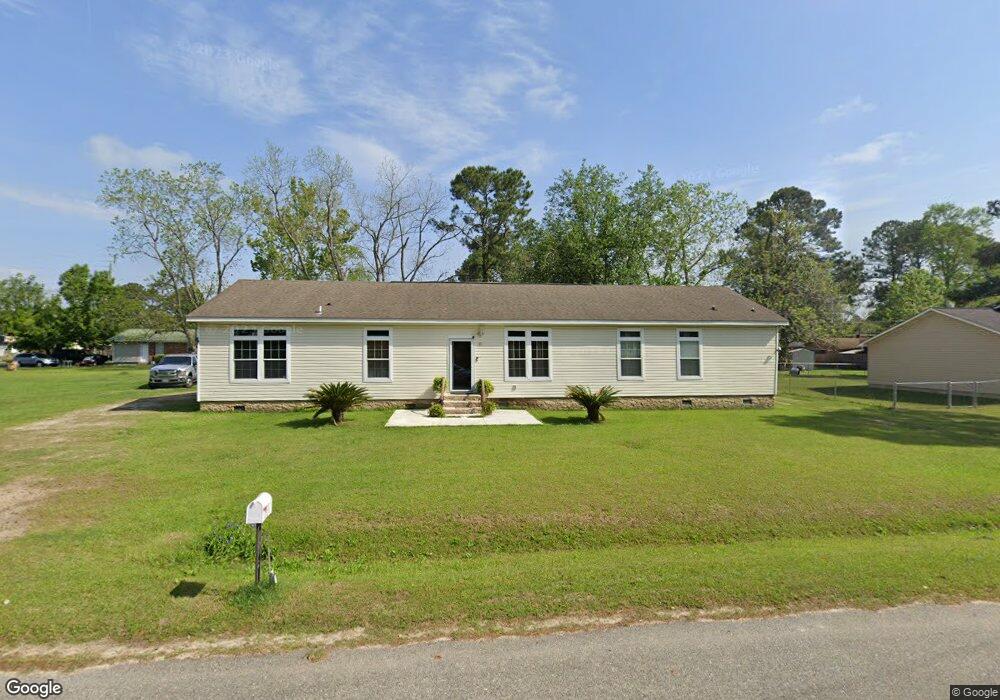
About This Home
This home is located at 611 Southbrook Dr, Tifton, GA 31794 and is currently estimated at $183,528, approximately $80 per square foot. 611 Southbrook Dr is a home located in Tift County with nearby schools including J.T. Reddick School, Matt Wilson Elementary School, and Annie Belle Clark Primary School.
Ownership History
Date
Name
Owned For
Owner Type
Purchase Details
Closed on
Mar 29, 2019
Sold by
Eastview Community Partnership Inc
Bought by
Walker Walter and Walker Elizabeth Ann
Current Estimated Value
Purchase Details
Closed on
Dec 20, 2018
Sold by
Secretary Of Housing And Urban Developme
Bought by
Eastview Community Partnership Inc
Purchase Details
Closed on
Feb 6, 2018
Sold by
Baker Anthony L
Bought by
Freedom Mtg Corp
Purchase Details
Closed on
Jul 3, 2008
Sold by
Lawrence Jason
Bought by
Baker Jermarviere M
Purchase Details
Closed on
Aug 23, 2007
Sold by
The Erie Co
Bought by
Upshaw Jason and Upshaw Lawrence Jason
Purchase Details
Closed on
Jun 3, 2003
Sold by
Newton James E and Newton Frances B
Bought by
The Erie Company
Purchase Details
Closed on
Oct 1, 1995
Bought by
Newton James E
Create a Home Valuation Report for This Property
The Home Valuation Report is an in-depth analysis detailing your home's value as well as a comparison with similar homes in the area
Home Values in the Area
Average Home Value in this Area
Purchase History
| Date | Buyer | Sale Price | Title Company |
|---|---|---|---|
| Walker Walter | $83,500 | -- | |
| Eastview Community Partnership Inc | $72,351 | -- | |
| Freedom Mtg Corp | $77,000 | -- | |
| Secretary Of Housing And Urban Developme | $77,000 | -- | |
| Baker Jermarviere M | $10,000 | -- | |
| Upshaw Jason | $10,000 | -- | |
| The Erie Company | $8,500 | -- | |
| Newton James E | -- | -- |
Source: Public Records
Tax History Compared to Growth
Tax History
| Year | Tax Paid | Tax Assessment Tax Assessment Total Assessment is a certain percentage of the fair market value that is determined by local assessors to be the total taxable value of land and additions on the property. | Land | Improvement |
|---|---|---|---|---|
| 2024 | $2,188 | $97,815 | $3,200 | $94,615 |
| 2023 | $2,319 | $49,558 | $3,000 | $46,558 |
| 2022 | $1,513 | $49,558 | $3,000 | $46,558 |
| 2021 | $1,521 | $49,558 | $3,000 | $46,558 |
| 2020 | $1,057 | $49,558 | $3,000 | $46,558 |
| 2019 | $918 | $49,558 | $3,000 | $46,558 |
| 2018 | $1,483 | $49,558 | $3,000 | $46,558 |
| 2017 | $1,490 | $49,558 | $3,000 | $46,558 |
| 2016 | $1,492 | $49,558 | $3,000 | $46,558 |
| 2015 | $1,492 | $49,558 | $3,000 | $46,558 |
| 2014 | $1,441 | $47,834 | $3,000 | $44,834 |
| 2013 | -- | $47,833 | $3,000 | $44,833 |
Source: Public Records
Map
Nearby Homes
- 4108 Plaza Dr
- 2901 3rd Ave
- 0 Union Rd
- 4480 Union Rd
- 2729 Central Ave S
- 13 Amoco Rd
- 2906 S Park Ave
- 604 Golden Rd W
- 1911 Park Ave S
- 1910 Park Ave S
- 0 Jordan Rd
- 603 21st St W
- 100 Palmetta Rd
- 18 Tifton Eldorado Rd
- 1520 Brookvale Dr Unit 19
- 1520 Brookvale Dr
- 64 Palmetta Rd
- 614/620 Old Omega Rd
- 0076 001 Tifton Eldorado Rd
- 0 Georgia 125
- 613 Southbrook Dr
- 602 Golden Rd E
- 610 Golden Rd E
- 600 Golden Rd E
- 612 Golden Rd E
- 0 Southbrook Dr
- 615 Southbrook Dr
- 614 Golden Rd E
- 4110 Midland Ave
- 516 Golden Rd E
- 4107 Midland Ave
- 516 Southbrook Dr
- 609 Golden Rd E
- 611 Golden Rd E
- 605 Golden Rd E
- 616 Golden Rd E
- 613 Golden Rd E
- 514 Golden Rd E
- 514 1/2 Golden Rd E
- 4111 Wesley Chappel Rd