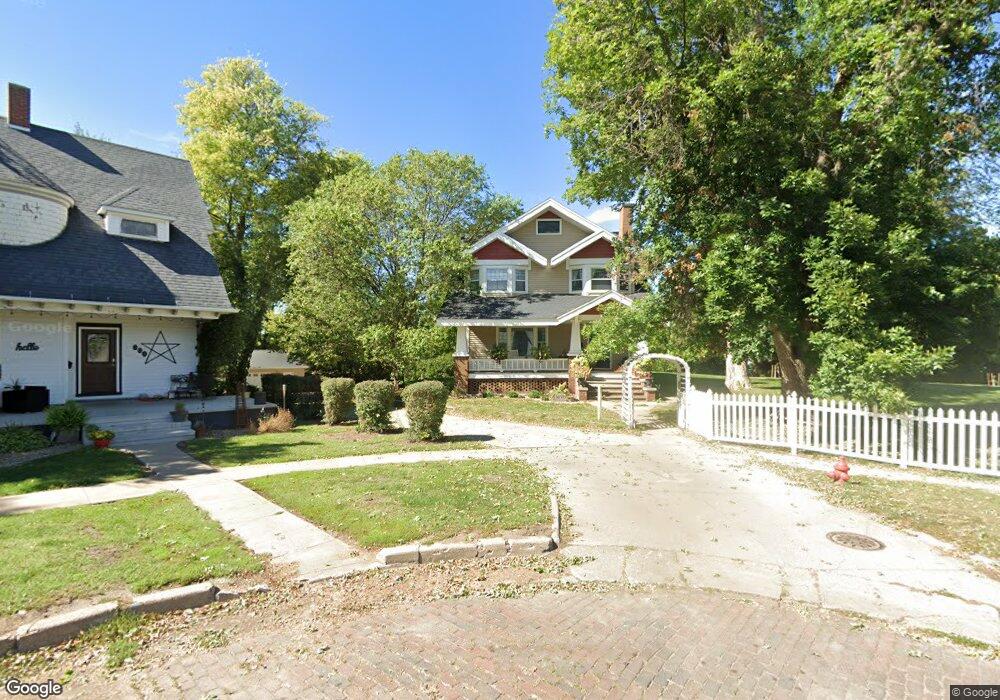
611 W 5th St Vinton, IA 52349
Estimated Value: $280,000 - $329,000
4
Beds
3
Baths
3,701
Sq Ft
$81/Sq Ft
Est. Value
About This Home
This home is located at 611 W 5th St, Vinton, IA 52349 and is currently estimated at $300,912, approximately $81 per square foot. 611 W 5th St is a home located in Benton County with nearby schools including Tilford Elementary School, Vinton-Shellsburg Middle School, and Vinton-Shellsburg High School.
Ownership History
Date
Name
Owned For
Owner Type
Purchase Details
Closed on
Dec 18, 2008
Sold by
West Jill M and Gardner Jill M
Bought by
Davis Ryan E and Davis Melanie S
Current Estimated Value
Home Financials for this Owner
Home Financials are based on the most recent Mortgage that was taken out on this home.
Original Mortgage
$121,250
Outstanding Balance
$79,447
Interest Rate
5.96%
Mortgage Type
New Conventional
Estimated Equity
$221,465
Purchase Details
Closed on
Aug 17, 2007
Sold by
Faust William J and Faust Marilyn K
Bought by
Gardner Bruce A and Gardner Jill M
Home Financials for this Owner
Home Financials are based on the most recent Mortgage that was taken out on this home.
Original Mortgage
$132,000
Interest Rate
6.79%
Mortgage Type
New Conventional
Create a Home Valuation Report for This Property
The Home Valuation Report is an in-depth analysis detailing your home's value as well as a comparison with similar homes in the area
Home Values in the Area
Average Home Value in this Area
Purchase History
| Date | Buyer | Sale Price | Title Company |
|---|---|---|---|
| Davis Ryan E | $125,000 | None Available | |
| Gardner Bruce A | $165,000 | None Available |
Source: Public Records
Mortgage History
| Date | Status | Borrower | Loan Amount |
|---|---|---|---|
| Open | Davis Ryan E | $121,250 | |
| Previous Owner | Gardner Bruce A | $132,000 |
Source: Public Records
Tax History
| Year | Tax Paid | Tax Assessment Tax Assessment Total Assessment is a certain percentage of the fair market value that is determined by local assessors to be the total taxable value of land and additions on the property. | Land | Improvement |
|---|---|---|---|---|
| 2025 | $4,408 | $270,500 | $41,200 | $229,300 |
| 2024 | $4,408 | $245,500 | $39,400 | $206,100 |
| 2023 | $4,118 | $245,500 | $39,400 | $206,100 |
| 2022 | $4,224 | $200,200 | $31,500 | $168,700 |
| 2021 | $4,224 | $200,200 | $31,500 | $168,700 |
| 2020 | $3,812 | $185,000 | $35,800 | $149,200 |
| 2019 | $3,734 | $185,000 | $35,800 | $149,200 |
| 2018 | $3,624 | $178,900 | $34,800 | $144,100 |
| 2017 | $3,480 | $178,900 | $34,800 | $144,100 |
| 2016 | $3,420 | $167,200 | $32,500 | $134,700 |
| 2015 | $3,420 | $167,200 | $32,500 | $134,700 |
| 2014 | $3,294 | $161,000 | $0 | $0 |
Source: Public Records
Map
Nearby Homes
- 209 W 5th St
- 511 1st Ave
- 1002 J Ave
- 1006 J Ave
- 507 W 13th St
- 1206 J Ave
- 1001 W 13th St
- 212 E 9th St
- 1005 W 13th St
- 1009 W 13th St
- 807 W 13th St
- 913 W 13th St
- 302 E 9th St
- 0 Lot 32 Mary Ingalls Subdivision Unit 2602214
- 516 E 4th St
- 206 E 13th St
- 614 E 4th St
- 501 E 11th St
- 304 Viking Dr
- 107 Blue Jay Ave
Your Personal Tour Guide
Ask me questions while you tour the home.