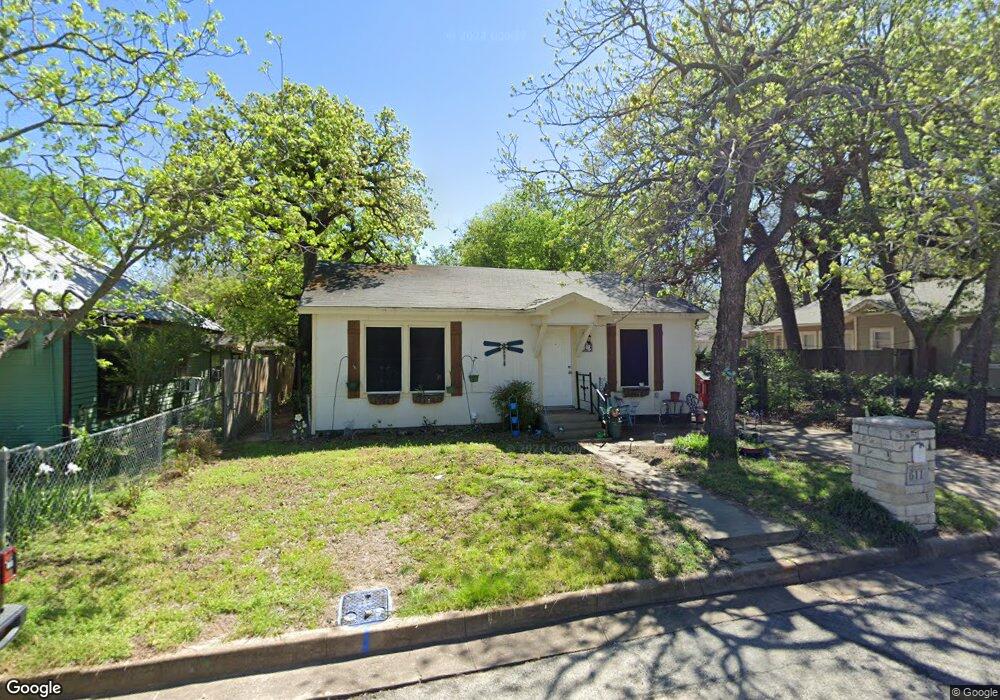
611 W Bridge St Weatherford, TX 76086
Estimated Value: $219,432 - $272,000
3
Beds
2
Baths
1,288
Sq Ft
$184/Sq Ft
Est. Value
About This Home
This home is located at 611 W Bridge St, Weatherford, TX 76086 and is currently estimated at $236,608, approximately $183 per square foot. 611 W Bridge St is a home located in Parker County with nearby schools including Curtis Elementary School, Hall Middle School, and Weatherford High School.
Ownership History
Date
Name
Owned For
Owner Type
Purchase Details
Closed on
Jul 15, 2016
Sold by
Valdez Karl
Bought by
Cooper Lori M
Current Estimated Value
Purchase Details
Closed on
Apr 22, 2016
Sold by
Cox Scotty Joe and Cammie Shea
Bought by
Cooper Lori M
Purchase Details
Closed on
May 15, 1991
Bought by
Cooper Lori M
Create a Home Valuation Report for This Property
The Home Valuation Report is an in-depth analysis detailing your home's value as well as a comparison with similar homes in the area
Home Values in the Area
Average Home Value in this Area
Purchase History
| Date | Buyer | Sale Price | Title Company |
|---|---|---|---|
| Cooper Lori M | -- | -- | |
| Cooper Lori M | -- | -- | |
| Cooper Lori M | -- | -- |
Source: Public Records
Tax History Compared to Growth
Tax History
| Year | Tax Paid | Tax Assessment Tax Assessment Total Assessment is a certain percentage of the fair market value that is determined by local assessors to be the total taxable value of land and additions on the property. | Land | Improvement |
|---|---|---|---|---|
| 2025 | $1,579 | $149,254 | -- | -- |
| 2024 | $1,579 | $135,685 | -- | -- |
| 2023 | $1,579 | $123,350 | $0 | $0 |
| 2022 | $2,487 | $112,230 | $15,000 | $97,230 |
| 2021 | $2,448 | $112,230 | $15,000 | $97,230 |
| 2020 | $2,239 | $92,680 | $15,000 | $77,680 |
| 2019 | $2,219 | $92,680 | $15,000 | $77,680 |
| 2018 | $2,026 | $78,980 | $15,000 | $63,980 |
| 2017 | $2,078 | $78,980 | $15,000 | $63,980 |
| 2016 | $1,285 | $48,830 | $15,000 | $33,830 |
| 2015 | $315 | $48,830 | $15,000 | $33,830 |
| 2014 | $461 | $46,920 | $15,000 | $31,920 |
Source: Public Records
Map
Nearby Homes
- 702 W Spring St
- 516 W Spring St
- 514 W Spring St
- 606 Palo Pinto St
- 707 W Water St
- 517 W Water St
- 905 W Oak St
- 427 W Ball St
- 314 N Dubellette St
- 509 Bryan St
- 313 N Dubellette St
- 1007 W Water St
- 616 W Baylor St
- 220 S Merrimac
- 514 W Baylor St
- 1105 Palo Pinto St
- 430 Vine St
- 510 N Boundary St
- 407 W Columbia St
- 418 Shannon
- 609 W Bridge St
- 613 W Bridge St
- 206 Hobson St
- 603 W Bridge St
- 610 W Spring St
- 612 W Bridge St
- 701 W Bridge St
- 209 Bryan St
- 608 W Spring St
- 614 W Spring St
- 616 W Bridge St
- 211 Bryan St
- 207 Hobson St
- 702 W Bridge St
- 703 W Bridge St
- 602 W Bridge St
- 602 W Spring St
- 308 Hobson St
- 705 W Bridge St
- 305 Bryan St