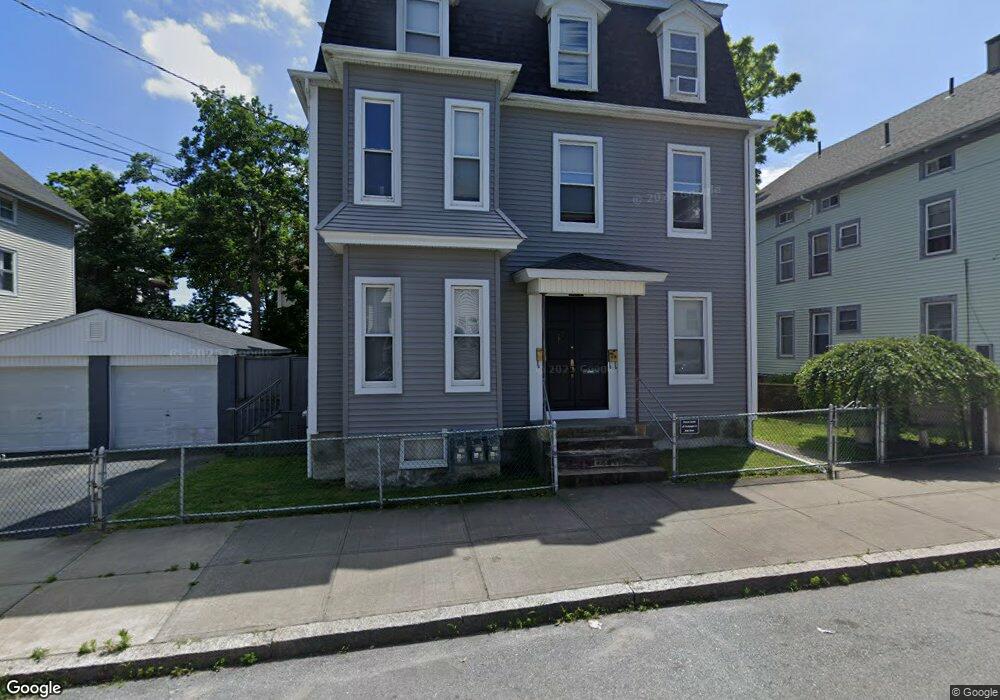
611 Walnut St Fall River, MA 02720
Bank Street NeighborhoodEstimated Value: $705,000 - $782,000
6
Beds
3
Baths
4,194
Sq Ft
$176/Sq Ft
Est. Value
About This Home
This home is located at 611 Walnut St, Fall River, MA 02720 and is currently estimated at $737,667, approximately $175 per square foot. 611 Walnut St is a home located in Bristol County with nearby schools including Mary Fonseca Elementary School, Morton Middle School, and B M C Durfee High School.
Ownership History
Date
Name
Owned For
Owner Type
Purchase Details
Closed on
Nov 7, 2001
Sold by
Simas Elizabeth M and Simas Martin G
Bought by
Dasilva Joseph M and Dasilva Sandy
Current Estimated Value
Home Financials for this Owner
Home Financials are based on the most recent Mortgage that was taken out on this home.
Original Mortgage
$87,500
Interest Rate
6.77%
Mortgage Type
Purchase Money Mortgage
Create a Home Valuation Report for This Property
The Home Valuation Report is an in-depth analysis detailing your home's value as well as a comparison with similar homes in the area
Home Values in the Area
Average Home Value in this Area
Purchase History
| Date | Buyer | Sale Price | Title Company |
|---|---|---|---|
| Dasilva Joseph M | $125,000 | -- |
Source: Public Records
Mortgage History
| Date | Status | Borrower | Loan Amount |
|---|---|---|---|
| Open | Dasilva Joseph M | $210,000 | |
| Closed | Dasilva Joseph M | $87,500 |
Source: Public Records
Tax History
| Year | Tax Paid | Tax Assessment Tax Assessment Total Assessment is a certain percentage of the fair market value that is determined by local assessors to be the total taxable value of land and additions on the property. | Land | Improvement |
|---|---|---|---|---|
| 2025 | $6,666 | $582,200 | $115,900 | $466,300 |
| 2024 | $5,892 | $512,800 | $113,600 | $399,200 |
| 2023 | $5,297 | $431,700 | $102,400 | $329,300 |
| 2022 | $4,318 | $373,100 | $96,600 | $276,500 |
| 2021 | $4,318 | $312,200 | $92,300 | $219,900 |
| 2020 | $3,867 | $267,600 | $88,100 | $179,500 |
| 2019 | $3,426 | $235,000 | $92,000 | $143,000 |
| 2018 | $3,091 | $211,400 | $92,700 | $118,700 |
| 2017 | $2,960 | $211,400 | $92,700 | $118,700 |
| 2016 | $2,881 | $211,400 | $95,600 | $115,800 |
| 2015 | $2,765 | $211,400 | $95,600 | $115,800 |
| 2014 | $2,797 | $222,300 | $95,600 | $126,700 |
Source: Public Records
Map
Nearby Homes
- 625 Walnut St
- 308 Linden St
- 308 Linden St Unit 3
- 308 Linden St Unit 2
- 308 Linden St Unit 1
- 599 Walnut St
- 300 Linden St
- 300 Linden St Unit 3
- 300 Linden St Unit 2
- 300 Linden St Unit 1
- 300 Linden St Unit 5
- 624 Walnut St
- 624 Walnut St Unit 1
- 624 Walnut St Unit 2
- 227 Grove St
- 596 Walnut St Unit 598
- 237 Grove St
- 245 Grove St
- 592 Walnut St
- 213 Grove St
Your Personal Tour Guide
Ask me questions while you tour the home.