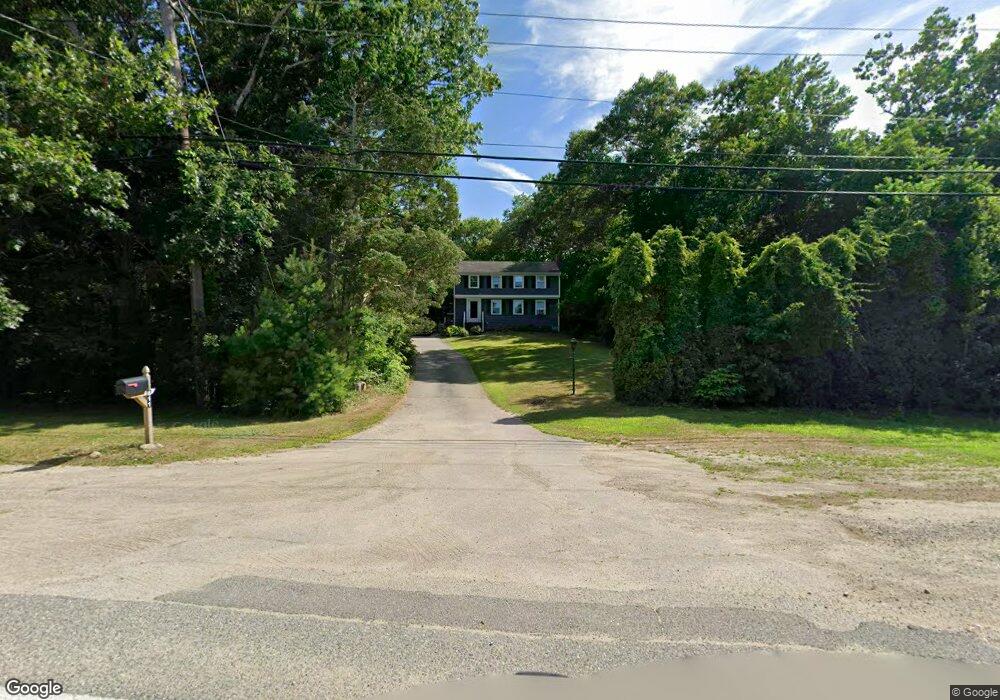
611 Webster St Marshfield, MA 02050
Estimated Value: $710,037 - $769,000
4
Beds
2
Baths
1,528
Sq Ft
$486/Sq Ft
Est. Value
About This Home
This home is located at 611 Webster St, Marshfield, MA 02050 and is currently estimated at $742,009, approximately $485 per square foot. 611 Webster St is a home located in Plymouth County with nearby schools including Governor Edward Winslow School, Furnace Brook Middle School, and Marshfield High School.
Ownership History
Date
Name
Owned For
Owner Type
Purchase Details
Closed on
Feb 10, 2005
Sold by
Lento Roslie M
Bought by
King Kristen
Current Estimated Value
Home Financials for this Owner
Home Financials are based on the most recent Mortgage that was taken out on this home.
Original Mortgage
$309,600
Outstanding Balance
$158,192
Interest Rate
5.83%
Mortgage Type
Purchase Money Mortgage
Estimated Equity
$583,817
Create a Home Valuation Report for This Property
The Home Valuation Report is an in-depth analysis detailing your home's value as well as a comparison with similar homes in the area
Home Values in the Area
Average Home Value in this Area
Purchase History
| Date | Buyer | Sale Price | Title Company |
|---|---|---|---|
| King Kristen | $387,000 | -- |
Source: Public Records
Mortgage History
| Date | Status | Borrower | Loan Amount |
|---|---|---|---|
| Open | King Kristen | $309,600 | |
| Closed | King Kristen | $58,050 | |
| Previous Owner | King Kristen | $331,692 | |
| Previous Owner | King Kristen | $40,000 |
Source: Public Records
Tax History
| Year | Tax Paid | Tax Assessment Tax Assessment Total Assessment is a certain percentage of the fair market value that is determined by local assessors to be the total taxable value of land and additions on the property. | Land | Improvement |
|---|---|---|---|---|
| 2025 | $6,040 | $610,100 | $320,200 | $289,900 |
| 2024 | $5,838 | $561,900 | $304,900 | $257,000 |
| 2023 | $5,732 | $506,400 | $283,100 | $223,300 |
| 2022 | $5,409 | $417,700 | $228,700 | $189,000 |
| 2021 | $5,229 | $396,400 | $226,500 | $169,900 |
| 2020 | $4,959 | $372,000 | $206,900 | $165,100 |
| 2019 | $4,849 | $362,400 | $206,900 | $155,500 |
| 2018 | $4,803 | $359,200 | $206,900 | $152,300 |
| 2017 | $4,581 | $333,900 | $196,000 | $137,900 |
| 2016 | $4,332 | $312,100 | $185,100 | $127,000 |
| 2015 | $4,105 | $308,900 | $185,100 | $123,800 |
| 2014 | $3,841 | $289,000 | $169,900 | $119,100 |
Source: Public Records
Map
Nearby Homes
- 625 Webster St
- 605 Webster St
- 595 Webster St
- 595 Webster St Unit 595
- 595 Webster St Unit 1
- 601 Webster St
- 610 Webster St
- 600 Webster St
- 583 Webster St
- 590 Webster St
- 575 Webster St
- 580 Webster St
- 569 Webster St
- 37 Fairways Edge Dr
- 27 Fairways Edge Dr
- 555 Webster St
- 660 Webster St
- 50 Whitford Cir
- 558 Webster St
- 40 Whitford Cir
Your Personal Tour Guide
Ask me questions while you tour the home.