
Seller's Agent in 2025
Bruce Evans
EXIT For Sale Realty
(706) 319-3315
337 Total Sales
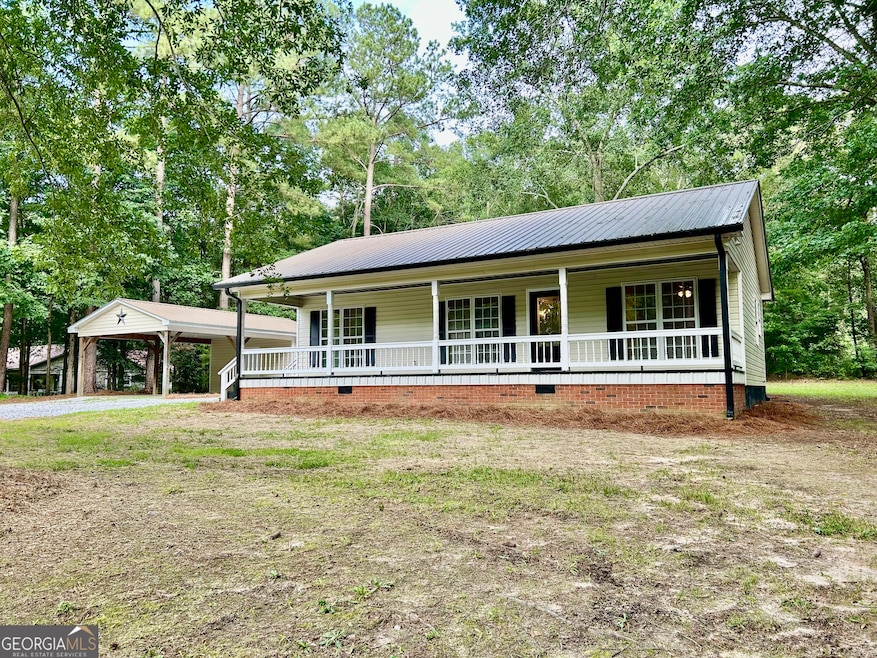
Adorable 3 bedroom, 2 bathroom located in a well established, quiet neighborhood. The property features neutral tones throughout, upgraded flooring/trim, and industrial farmhouse details from fixtures to vanities. The metal roof equates to maintenance free for years to come! There is also a detached garage with a storage area. You won't want to miss the chance to call this cutie HOME!
Last Agent to Sell the Property
EXIT For Sale Realty License #382550 Listed on: 06/20/2025
| Date | Type | Sale Price | Title Company |
|---|---|---|---|
| Warranty Deed | $80,500 | -- | |
| Foreclosure Deed | $92,812 | -- | |
| Warranty Deed | $80,000 | -- | |
| Warranty Deed | $93,500 | -- | |
| Deed | $106,000 | -- | |
| Deed | $9,000 | -- | |
| Deed | -- | -- |
| Date | Status | Loan Amount | Loan Type |
|---|---|---|---|
| Previous Owner | $80,000 | No Value Available |
| Date | Event | Price | List to Sale | Price per Sq Ft |
|---|---|---|---|---|
| 07/15/2025 07/15/25 | Sold | $216,000 | +10.8% | $171 / Sq Ft |
| 06/23/2025 06/23/25 | Pending | -- | -- | -- |
| 06/20/2025 06/20/25 | For Sale | $195,000 | -- | $154 / Sq Ft |
| Year | Tax Paid | Tax Assessment Tax Assessment Total Assessment is a certain percentage of the fair market value that is determined by local assessors to be the total taxable value of land and additions on the property. | Land | Improvement |
|---|---|---|---|---|
| 2024 | $772 | $49,258 | $3,277 | $45,981 |
| 2023 | $1,409 | $58,752 | $3,277 | $55,474 |
| 2022 | $1,038 | $50,032 | $1,952 | $48,080 |
| 2021 | $1,039 | $50,032 | $1,952 | $48,080 |
| 2020 | $945 | $41,451 | $1,560 | $39,891 |
| 2019 | $987 | $41,451 | $1,560 | $39,891 |
| 2018 | $1,021 | $41,451 | $1,560 | $39,891 |
| 2017 | $902 | $35,027 | $1,560 | $33,467 |
| 2016 | $969 | $35,027 | $1,560 | $33,467 |
| 2015 | -- | $35,027 | $1,560 | $33,467 |
| 2014 | -- | $37,772 | $1,560 | $36,211 |
| 2013 | -- | $37,772 | $1,560 | $36,211 |
Seller's Agent in 2025
Bruce Evans
EXIT For Sale Realty
(706) 319-3315
337 Total Sales
W
Buyer's Agent in 2025
Whitney Carey
Carey-Dean Real Estate
(706) 540-4023
62 Total Sales
Source: Georgia MLS
MLS Number: 10547769
APN: 011A-030
Disclaimer: Certain information contained herein is derived from information provided by parties other than Homes.com. All information provided is deemed reliable, but is not guaranteed to be accurate and should be independently verified.
![]() The data relating to real estate for sale on this web site comes in part from the Broker Reciprocity Program of Georgia MLS. Real estate listings held by brokerage firms other than Redfin are marked with the Broker Reciprocity logo and detailed information about them includes the name of the listing brokers. Information deemed reliable but not guaranteed. Copyright 2025 Georgia MLS. All rights reserved.
The data relating to real estate for sale on this web site comes in part from the Broker Reciprocity Program of Georgia MLS. Real estate listings held by brokerage firms other than Redfin are marked with the Broker Reciprocity logo and detailed information about them includes the name of the listing brokers. Information deemed reliable but not guaranteed. Copyright 2025 Georgia MLS. All rights reserved.