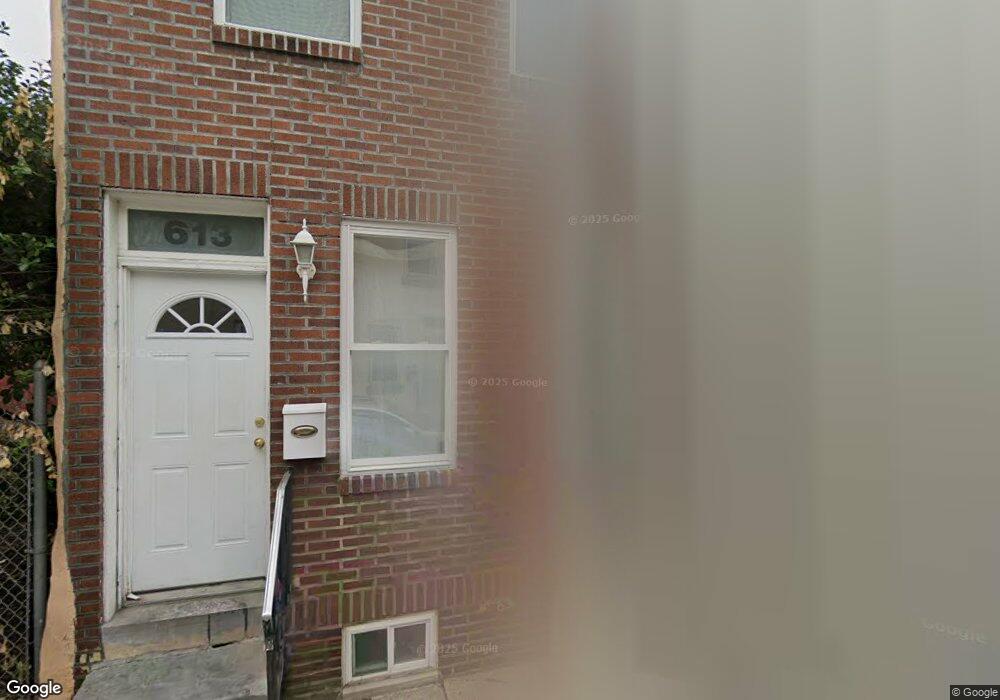
611 Winton St Philadelphia, PA 19148
South Philadelphia East NeighborhoodEstimated Value: $250,127 - $286,000
2
Beds
1
Bath
984
Sq Ft
$271/Sq Ft
Est. Value
About This Home
This home is located at 611 Winton St, Philadelphia, PA 19148 and is currently estimated at $266,282, approximately $270 per square foot. 611 Winton St is a home located in Philadelphia County with nearby schools including South Philadelphia High School, Key Francis Scott School, and Saints John Neumann and Maria Goretti Catholic High School.
Ownership History
Date
Name
Owned For
Owner Type
Purchase Details
Closed on
May 1, 2018
Sold by
Kyheen Washington Kama L and Washington Kamal Kyheen
Bought by
Zheng Meichun and Zheng Xiaofang
Current Estimated Value
Purchase Details
Closed on
Aug 16, 2010
Sold by
Robinson David and Robinson Tina
Bought by
Washington Kama L Kyheen
Purchase Details
Closed on
Apr 17, 1998
Sold by
Robinson James M
Bought by
Robinson David and Robinson Tina
Create a Home Valuation Report for This Property
The Home Valuation Report is an in-depth analysis detailing your home's value as well as a comparison with similar homes in the area
Home Values in the Area
Average Home Value in this Area
Purchase History
| Date | Buyer | Sale Price | Title Company |
|---|---|---|---|
| Zheng Meichun | $105,000 | Northeast Executive Abstract | |
| Washington Kama L Kyheen | $1,000 | None Available | |
| Robinson David | -- | -- |
Source: Public Records
Tax History Compared to Growth
Tax History
| Year | Tax Paid | Tax Assessment Tax Assessment Total Assessment is a certain percentage of the fair market value that is determined by local assessors to be the total taxable value of land and additions on the property. | Land | Improvement |
|---|---|---|---|---|
| 2026 | $2,889 | $230,300 | $46,060 | $184,240 |
| 2025 | $2,889 | $230,300 | $46,060 | $184,240 |
| 2024 | $2,889 | $230,300 | $46,060 | $184,240 |
| 2023 | $2,889 | $206,400 | $41,280 | $165,120 |
| 2022 | $2,259 | $161,400 | $41,280 | $120,120 |
| 2021 | $2,139 | $0 | $0 | $0 |
| 2020 | $2,139 | $0 | $0 | $0 |
| 2019 | $1,688 | $0 | $0 | $0 |
| 2018 | $1,362 | $0 | $0 | $0 |
| 2017 | $1,362 | $0 | $0 | $0 |
| 2016 | $942 | $0 | $0 | $0 |
| 2015 | -- | $0 | $0 | $0 |
| 2014 | -- | $117,000 | $10,013 | $106,987 |
| 2012 | -- | $4,160 | $1,049 | $3,111 |
Source: Public Records
Map
Nearby Homes