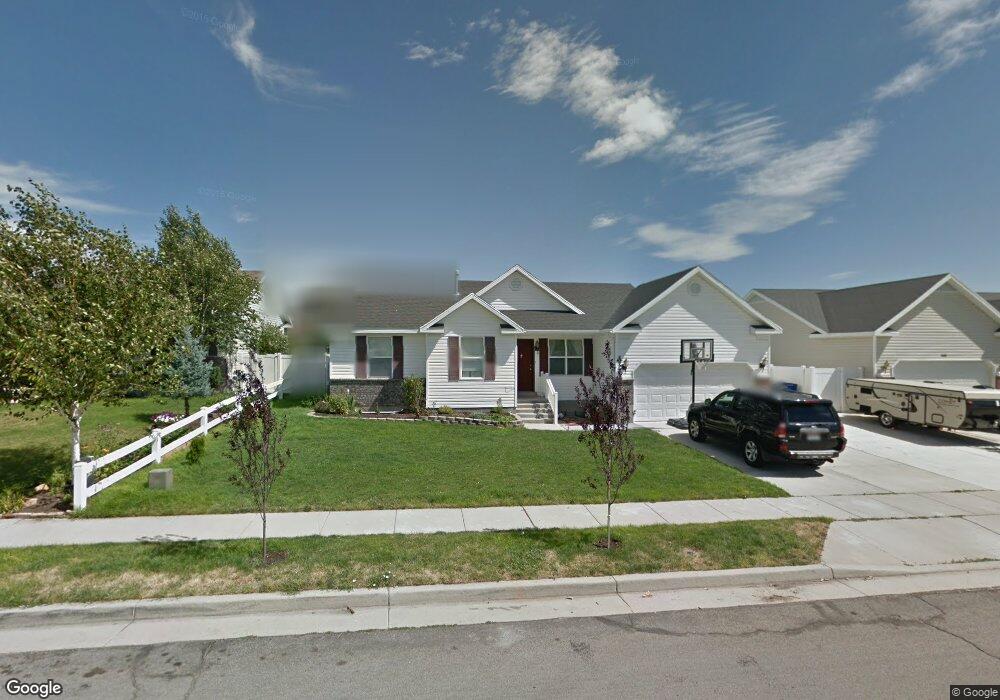
6110 Duchess St West Jordan, UT 84081
Oquirrh NeighborhoodEstimated Value: $465,000 - $504,000
3
Beds
2
Baths
2,315
Sq Ft
$209/Sq Ft
Est. Value
About This Home
This home is located at 6110 Duchess St, West Jordan, UT 84081 and is currently estimated at $483,035, approximately $208 per square foot. 6110 Duchess St is a home located in Salt Lake County with nearby schools including Falcon Ridge School, Sunset Ridge Middle School, and Copper Hills High School.
Ownership History
Date
Name
Owned For
Owner Type
Purchase Details
Closed on
Jul 31, 2013
Sold by
Eldredge Alison Lee and Lee Alison
Bought by
Eldredge Fred and Eldredge Alison Lee
Current Estimated Value
Purchase Details
Closed on
Jun 26, 2008
Sold by
Trabanino Jose
Bought by
Trabanino Jose and Arbizu Edy
Home Financials for this Owner
Home Financials are based on the most recent Mortgage that was taken out on this home.
Original Mortgage
$174,218
Outstanding Balance
$111,936
Interest Rate
5.99%
Mortgage Type
Purchase Money Mortgage
Estimated Equity
$371,099
Purchase Details
Closed on
Jun 25, 2008
Sold by
Lancaster Kevin and Lancaster Careen Simmons
Bought by
Trabanino Jose
Home Financials for this Owner
Home Financials are based on the most recent Mortgage that was taken out on this home.
Original Mortgage
$174,218
Outstanding Balance
$111,936
Interest Rate
5.99%
Mortgage Type
Purchase Money Mortgage
Estimated Equity
$371,099
Purchase Details
Closed on
Mar 28, 2003
Sold by
Rochelle Investments Lc
Bought by
Lancaster Kevin and Simmons Careen
Home Financials for this Owner
Home Financials are based on the most recent Mortgage that was taken out on this home.
Original Mortgage
$150,621
Interest Rate
5.78%
Mortgage Type
FHA
Create a Home Valuation Report for This Property
The Home Valuation Report is an in-depth analysis detailing your home's value as well as a comparison with similar homes in the area
Home Values in the Area
Average Home Value in this Area
Purchase History
| Date | Buyer | Sale Price | Title Company |
|---|---|---|---|
| Eldredge Fred | -- | Metro National Title | |
| Trabanino Jose | -- | Accommodation | |
| Trabanino Jose | -- | Metro National Title | |
| Lancaster Kevin | -- | Merrill Title |
Source: Public Records
Mortgage History
| Date | Status | Borrower | Loan Amount |
|---|---|---|---|
| Open | Trabanino Jose | $174,218 | |
| Previous Owner | Lancaster Kevin | $150,621 |
Source: Public Records
Tax History Compared to Growth
Tax History
| Year | Tax Paid | Tax Assessment Tax Assessment Total Assessment is a certain percentage of the fair market value that is determined by local assessors to be the total taxable value of land and additions on the property. | Land | Improvement |
|---|---|---|---|---|
| 2025 | $3,082 | $458,800 | $140,800 | $318,000 |
| 2024 | $3,082 | $437,200 | $135,400 | $301,800 |
| 2023 | $3,322 | $413,900 | $130,200 | $283,700 |
| 2022 | $3,162 | $429,200 | $127,700 | $301,500 |
| 2021 | $2,728 | $348,400 | $98,200 | $250,200 |
| 2020 | $2,662 | $307,500 | $91,100 | $216,400 |
| 2019 | $2,613 | $293,600 | $85,900 | $207,700 |
| 2018 | $2,455 | $270,400 | $85,900 | $184,500 |
| 2017 | $2,222 | $254,100 | $85,900 | $168,200 |
| 2016 | $2,275 | $244,100 | $79,600 | $164,500 |
| 2015 | $1,948 | $205,300 | $85,600 | $119,700 |
| 2014 | $1,913 | $197,400 | $82,900 | $114,500 |
Source: Public Records
Map
Nearby Homes
- 6761 S High Bluff Dr
- 6150 W Nellies St
- 6116 W Graceland Way
- 6389 S Mill Valley Ct
- 6223 W Mill Valley Ln
- 6401 S High Bluff Dr
- 6977 W Hidden Way S Unit 147
- 5732 W Moon Crest Ct
- 6301 W Passenger Ln Unit 2
- 6721 Adventure Way
- 6364 W Passenger Ln
- 6739 S Sol Rise Dr
- 5557 W Joshua Cir
- 6880 S Mount Berry Rd Unit 410
- 7134 S Rialto Way
- 5466 Ticklegrass Rd
- 5502 Starflower Way
- Lincoln Plan at Sky Ranch - Legacy
- Mckinley Plan at Sky Ranch - Legacy
- Washington Plan at Sky Ranch - Legacy
- 6104 Duchess St
- 6122 Duchess St
- 6122 W Duchess St
- 6104 Duchess St
- 6104 W Duchess St
- 6111 W Cedar Hill Rd
- 6119 W Cedar Hill Rd
- 6119 W Cedar Hill Rd
- 6103 W Cedar Hill Rd
- 6103 W Cedar Hill Rd
- 6127 W Cedar Hill Rd
- 6127 W Cedar Hill Rd
- 6092 Duchess St
- 6092 W Duchess St
- 6134 Duchess St
- 6134 W Duchess St
- 6117 Duchess St
- 6109 Duchess St
- 6127 Duchess St
- 6097 W Cedar Hill Rd