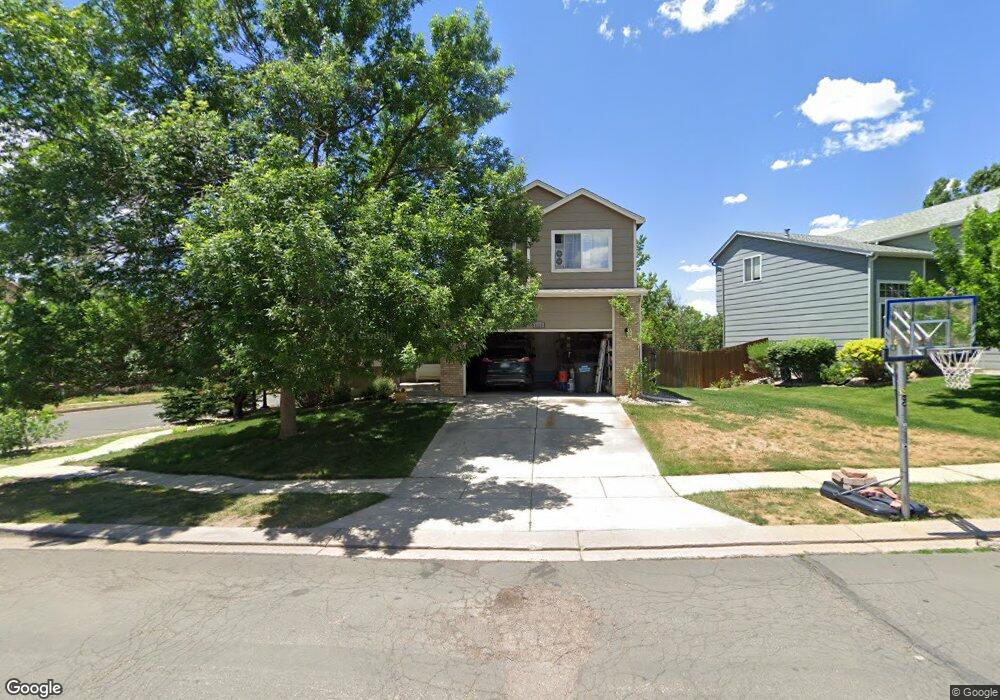
6110 Fossil Dr Colorado Springs, CO 80923
Sundown NeighborhoodEstimated Value: $432,000 - $450,283
3
Beds
3
Baths
1,493
Sq Ft
$295/Sq Ft
Est. Value
About This Home
This home is located at 6110 Fossil Dr, Colorado Springs, CO 80923 and is currently estimated at $440,071, approximately $294 per square foot. 6110 Fossil Dr is a home located in El Paso County with nearby schools including Scott Elementary School, Jenkins Middle School, and Doherty High School.
Ownership History
Date
Name
Owned For
Owner Type
Purchase Details
Closed on
Aug 17, 2006
Sold by
Spelman John and Spelman Lisa
Bought by
Appleman Brenton T
Current Estimated Value
Home Financials for this Owner
Home Financials are based on the most recent Mortgage that was taken out on this home.
Original Mortgage
$168,000
Outstanding Balance
$100,810
Interest Rate
6.75%
Mortgage Type
Unknown
Estimated Equity
$339,261
Purchase Details
Closed on
Mar 27, 2003
Sold by
Maethner Scott
Bought by
Spelman John and Vanhoeck Lisa
Home Financials for this Owner
Home Financials are based on the most recent Mortgage that was taken out on this home.
Original Mortgage
$174,757
Interest Rate
5.83%
Mortgage Type
FHA
Purchase Details
Closed on
May 30, 1997
Sold by
Richmond American Homes Of Colorado Inc
Bought by
Maethner Scott
Home Financials for this Owner
Home Financials are based on the most recent Mortgage that was taken out on this home.
Original Mortgage
$137,669
Interest Rate
8.1%
Mortgage Type
VA
Create a Home Valuation Report for This Property
The Home Valuation Report is an in-depth analysis detailing your home's value as well as a comparison with similar homes in the area
Home Values in the Area
Average Home Value in this Area
Purchase History
| Date | Buyer | Sale Price | Title Company |
|---|---|---|---|
| Appleman Brenton T | $210,000 | Security Title | |
| Spelman John | $177,500 | Security Title | |
| Maethner Scott | $135,207 | Land Title |
Source: Public Records
Mortgage History
| Date | Status | Borrower | Loan Amount |
|---|---|---|---|
| Open | Appleman Brenton T | $168,000 | |
| Previous Owner | Spelman John | $174,757 | |
| Previous Owner | Maethner Scott | $137,669 |
Source: Public Records
Tax History Compared to Growth
Tax History
| Year | Tax Paid | Tax Assessment Tax Assessment Total Assessment is a certain percentage of the fair market value that is determined by local assessors to be the total taxable value of land and additions on the property. | Land | Improvement |
|---|---|---|---|---|
| 2025 | $1,604 | $31,050 | -- | -- |
| 2024 | $1,490 | $31,330 | $4,820 | $26,510 |
| 2023 | $1,490 | $31,330 | $4,820 | $26,510 |
| 2022 | $1,329 | $22,190 | $4,000 | $18,190 |
| 2021 | $1,437 | $22,830 | $4,110 | $18,720 |
| 2020 | $1,273 | $17,730 | $3,580 | $14,150 |
| 2019 | $1,267 | $17,730 | $3,580 | $14,150 |
| 2018 | $1,199 | $15,510 | $2,880 | $12,630 |
| 2017 | $1,139 | $15,510 | $2,880 | $12,630 |
| 2016 | $942 | $15,210 | $3,020 | $12,190 |
| 2015 | $938 | $15,210 | $3,020 | $12,190 |
| 2014 | $912 | $14,220 | $3,020 | $11,200 |
Source: Public Records
Map
Nearby Homes
- 5185 Balsam St
- 5956 Santana Dr
- 6030 Grapevine Dr
- 5965 Corinth Dr
- 5940 Corinth Dr
- 6026 Oakwood Blvd
- 5127 Rushford Place
- 5340 Slickrock Dr
- 6648 Sleeping Giant Dr
- 5346 Sunshade Point
- 5340 Sunshade Point
- 5123 Stillwater Dr
- 5040 Stillwater Dr
- 6556 Emerald Isle Heights
- 5551 Sunshade Point
- 5639 Sunshade Point
- 6465 Whirlwind Dr
- 5677 Saint Patrick View
- 5384 Oak Spring Heights
- 5468 Oak Spring Heights
- 6120 Fossil Dr
- 6043 Bow River Dr
- 6130 Fossil Dr
- 6060 Fossil Dr
- 5080 Stellar Dr
- 6115 Fossil Dr
- 6037 Bow River Dr
- 6049 Bow River Dr
- 6140 Fossil Dr
- 6050 Fossil Dr
- 6125 Fossil Dr
- 6065 Fossil Dr
- 6135 Fossil Dr
- 6031 Bow River Dr
- 6055 Bow River Dr
- 6040 Fossil Dr
- 6150 Fossil Dr
- 6055 Fossil Dr
- 6145 Fossil Dr
- 4965 Slickrock Dr