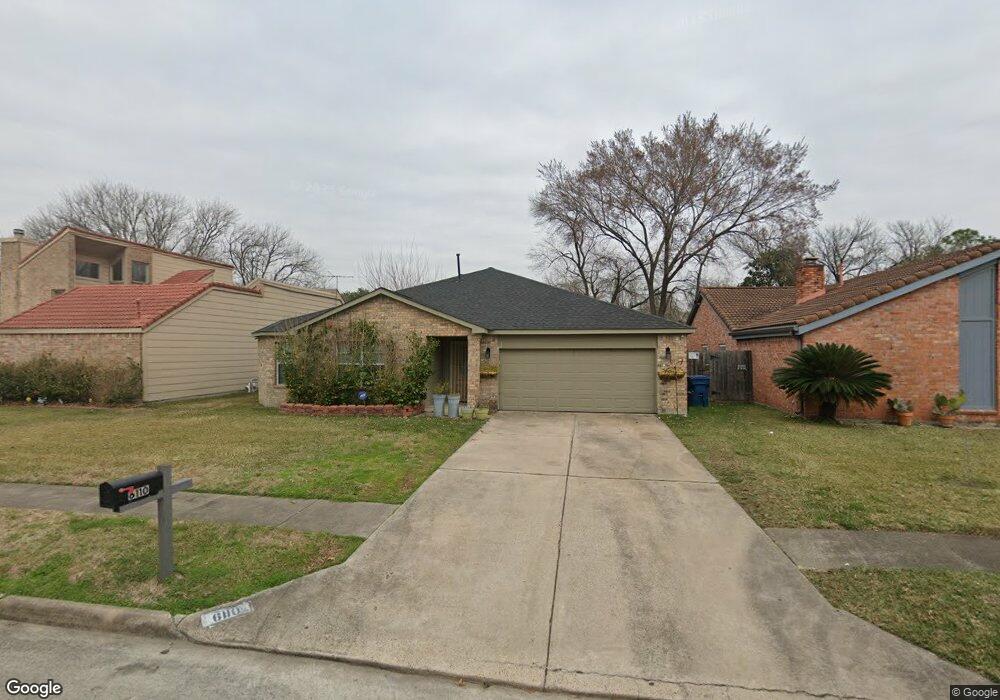
6110 Ogden Forest Dr Houston, TX 77088
Inwood North NeighborhoodEstimated Value: $255,000 - $312,560
4
Beds
3
Baths
2,394
Sq Ft
$121/Sq Ft
Est. Value
About This Home
This home is located at 6110 Ogden Forest Dr, Houston, TX 77088 and is currently estimated at $290,140, approximately $121 per square foot. 6110 Ogden Forest Dr is a home located in Harris County with nearby schools including Nitsch Elementary School, Klein Intermediate School, and Klein Forest High School.
Ownership History
Date
Name
Owned For
Owner Type
Purchase Details
Closed on
Apr 26, 2016
Sold by
Orgish Scot Carl
Bought by
Soto Eliasib Dimas and Dimas Reyna
Current Estimated Value
Home Financials for this Owner
Home Financials are based on the most recent Mortgage that was taken out on this home.
Original Mortgage
$173,794
Outstanding Balance
$143,052
Interest Rate
4.75%
Mortgage Type
FHA
Estimated Equity
$147,088
Purchase Details
Closed on
Jan 11, 2016
Sold by
Orgish Eleonore
Bought by
Orgish Scot
Purchase Details
Closed on
Jun 9, 2015
Sold by
Arnold Michael
Bought by
Orgish Eleonore
Purchase Details
Closed on
Jun 5, 2012
Sold by
Berry Kenneth W
Bought by
Harris County and Lone Star College System District
Purchase Details
Closed on
Jan 3, 1997
Sold by
Payne June M
Bought by
Drewry John W and Drewry Pamela
Create a Home Valuation Report for This Property
The Home Valuation Report is an in-depth analysis detailing your home's value as well as a comparison with similar homes in the area
Home Values in the Area
Average Home Value in this Area
Purchase History
| Date | Buyer | Sale Price | Title Company |
|---|---|---|---|
| Soto Eliasib Dimas | -- | Fidelity National Title | |
| Orgish Scot | -- | Attorney | |
| Orgish Eleonore | -- | None Available | |
| Harris County | -- | None Available | |
| Drewry John W | $6,500 | -- |
Source: Public Records
Mortgage History
| Date | Status | Borrower | Loan Amount |
|---|---|---|---|
| Open | Soto Eliasib Dimas | $173,794 |
Source: Public Records
Tax History Compared to Growth
Tax History
| Year | Tax Paid | Tax Assessment Tax Assessment Total Assessment is a certain percentage of the fair market value that is determined by local assessors to be the total taxable value of land and additions on the property. | Land | Improvement |
|---|---|---|---|---|
| 2025 | $7,477 | $342,896 | $56,700 | $286,196 |
| 2024 | $7,477 | $361,230 | $56,700 | $304,530 |
| 2023 | $7,477 | $384,269 | $56,700 | $327,569 |
| 2022 | $6,993 | $361,993 | $37,800 | $324,193 |
| 2021 | $6,702 | $266,774 | $23,625 | $243,149 |
| 2020 | $6,429 | $243,427 | $23,625 | $219,802 |
| 2019 | $6,022 | $212,577 | $15,120 | $197,457 |
| 2018 | $2,861 | $212,577 | $15,120 | $197,457 |
| 2017 | $6,024 | $212,577 | $15,120 | $197,457 |
| 2016 | $3,262 | $115,116 | $15,120 | $99,996 |
| 2015 | $424 | $22,630 | $15,120 | $7,510 |
| 2014 | $424 | $22,630 | $15,120 | $7,510 |
Source: Public Records
Map
Nearby Homes
- 6111 Ogden Forest Dr
- 6006 Ogden Forest Dr
- 6122 Gallant Forest Dr
- 6114 Elkwood Forest Dr
- 6023 Elkwood Forest Dr
- 8918 Bold Forest Dr
- 5942 Caruso Forest Dr
- 32 Regency Ln
- 5935 Caruso Forest Dr
- 5831 Longforest Dr
- 6222 Downwood Forest Dr
- 6703 Casablanca Dr
- 5718 Longforest Dr
- 8810 Enchanted Forest Dr
- 6630 Inwood Dr W
- 10126 Wild Hollow Ln
- 5638 Fairview Forest Dr
- 6011 Green Falls Dr
- 7709 Inwood Dr W
- 5622 Bridge Forest Dr
- 6114 Ogden Forest Dr
- 6106 Ogden Forest Dr
- 6111 Whitter Forest Dr
- 6118 Ogden Forest Dr
- 6115 Whitter Forest Dr
- 6107 Whitter Forest Dr
- 6102 Ogden Forest Dr
- 6119 Whitter Forest Dr
- 6103 Whitter Forest Dr
- 6115 Ogden Forest Dr
- 6122 Ogden Forest Dr
- 6107 Ogden Forest Dr
- 6026 Ogden Forest Dr
- 6119 Ogden Forest Dr
- 6123 Whitter Forest Dr
- 6103 Ogden Forest Dr
- 6027 Whitter Forest Dr
- 6123 Ogden Forest Dr
- 6126 Ogden Forest Dr
- 6022 Ogden Forest Dr