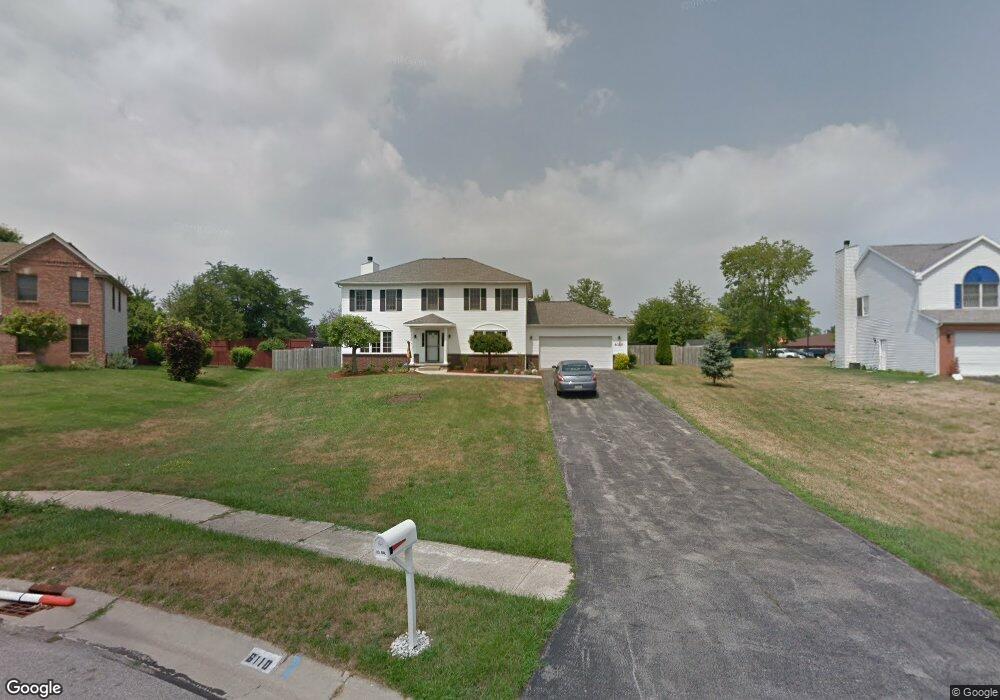
6110 Suffolk Ln Maumee, OH 43537
Southwyck NeighborhoodEstimated Value: $325,000 - $396,000
4
Beds
3
Baths
2,252
Sq Ft
$157/Sq Ft
Est. Value
About This Home
This home is located at 6110 Suffolk Ln, Maumee, OH 43537 and is currently estimated at $353,277, approximately $156 per square foot. 6110 Suffolk Ln is a home located in Lucas County with nearby schools including Holloway Elementary School, Springfield Middle School, and Springfield High School.
Ownership History
Date
Name
Owned For
Owner Type
Purchase Details
Closed on
May 6, 2009
Sold by
Us Bank National Association
Bought by
Curry Chervonne E
Current Estimated Value
Home Financials for this Owner
Home Financials are based on the most recent Mortgage that was taken out on this home.
Original Mortgage
$156,610
Interest Rate
4.94%
Mortgage Type
FHA
Purchase Details
Closed on
Sep 15, 2008
Sold by
Fanelli George O
Bought by
Us Bank National Association
Purchase Details
Closed on
Nov 25, 2002
Sold by
Farthing Rodney L and Farthing Carla A
Bought by
Fanelli George O
Home Financials for this Owner
Home Financials are based on the most recent Mortgage that was taken out on this home.
Original Mortgage
$174,800
Interest Rate
6.22%
Purchase Details
Closed on
Jan 25, 2001
Sold by
Krempa John C
Bought by
Farthing Rodney L and Farthing Carla A
Home Financials for this Owner
Home Financials are based on the most recent Mortgage that was taken out on this home.
Original Mortgage
$175,900
Interest Rate
10.12%
Purchase Details
Closed on
Jun 30, 1997
Sold by
Mercurio Dev Inc
Bought by
Advanced Building Concepts
Create a Home Valuation Report for This Property
The Home Valuation Report is an in-depth analysis detailing your home's value as well as a comparison with similar homes in the area
Home Values in the Area
Average Home Value in this Area
Purchase History
| Date | Buyer | Sale Price | Title Company |
|---|---|---|---|
| Curry Chervonne E | $159,500 | None Available | |
| Us Bank National Association | $132,667 | None Available | |
| Fanelli George O | $184,000 | American 1St | |
| Farthing Rodney L | $251,000 | American 1St | |
| Advanced Building Concepts | $69,500 | -- |
Source: Public Records
Mortgage History
| Date | Status | Borrower | Loan Amount |
|---|---|---|---|
| Previous Owner | Curry Chervonne E | $156,610 | |
| Previous Owner | Fanelli George O | $174,800 | |
| Previous Owner | Farthing Rodney L | $175,900 |
Source: Public Records
Tax History Compared to Growth
Tax History
| Year | Tax Paid | Tax Assessment Tax Assessment Total Assessment is a certain percentage of the fair market value that is determined by local assessors to be the total taxable value of land and additions on the property. | Land | Improvement |
|---|---|---|---|---|
| 2024 | $2,877 | $94,325 | $22,715 | $71,610 |
| 2023 | $5,698 | $81,760 | $17,080 | $64,680 |
| 2022 | $5,698 | $81,760 | $17,080 | $64,680 |
| 2021 | $5,359 | $81,760 | $17,080 | $64,680 |
| 2020 | $5,201 | $71,960 | $14,525 | $57,435 |
| 2019 | $5,081 | $71,960 | $14,525 | $57,435 |
| 2018 | $5,006 | $71,960 | $14,525 | $57,435 |
| 2017 | $4,734 | $62,440 | $16,695 | $45,745 |
| 2016 | $4,768 | $178,400 | $47,700 | $130,700 |
| 2015 | $4,759 | $178,400 | $47,700 | $130,700 |
| 2014 | $4,216 | $60,070 | $16,070 | $44,000 |
| 2013 | $4,216 | $60,070 | $16,070 | $44,000 |
Source: Public Records
Map
Nearby Homes
- 6053 Suffolk Ln Unit 6053
- 1705 Henthorne Dr
- 6505 Airport Hwy
- 5708 Aspen Dr Unit 11
- 1562 Saddlebrook Ct Unit B
- 2001 Perrysburg Holland Rd Unit 118
- 5713 Tibaron Ln Unit 203
- 5615 Baronswood Cir Unit 105
- 1533 Eaglebrook Rd
- 2124 Tanglewood Dr
- 1187 Hidden Ridge Rd Unit A
- 5609 Willowood Ct Unit 5609
- 6325 Millbrook Rd
- 6666 Inglewood Rd
- 6620 Pilliod Rd
- 2258 Tanglewood Dr
- 1144 Bernath Pkwy Unit D
- 8939 Airport Hwy
- 5741 Heatherbank Rd
- 2437 Knights Hill Ln
- 6100 Suffolk Ln
- 6116 Suffolk Ln
- 1677 Ravine Dr Unit 1677
- 1677 Ravine Dr Unit DR
- 1675 Ravine Dr
- 6107 Suffolk Ln
- 6057 Suffolk Ln Unit 6057
- 1669 Ravine Dr Unit 1669
- 1669 Ravine Dr Unit DRIVE
- 1669 Ravine Dr Unit DR
- 1671 Ravine Dr
- 1673 Ravine Dr
- 6122 Suffolk Ln
- 6055 Suffolk Ln
- 6113 Suffolk Ln
- 1627 Henthorne Dr
- 6051 Suffolk Ln Unit 6051
- 6053 Suffolk Ln Unit Suffolk Ln Condo
- 6049 Suffolk Ln Unit 6049
- 1667 Henthorne Dr