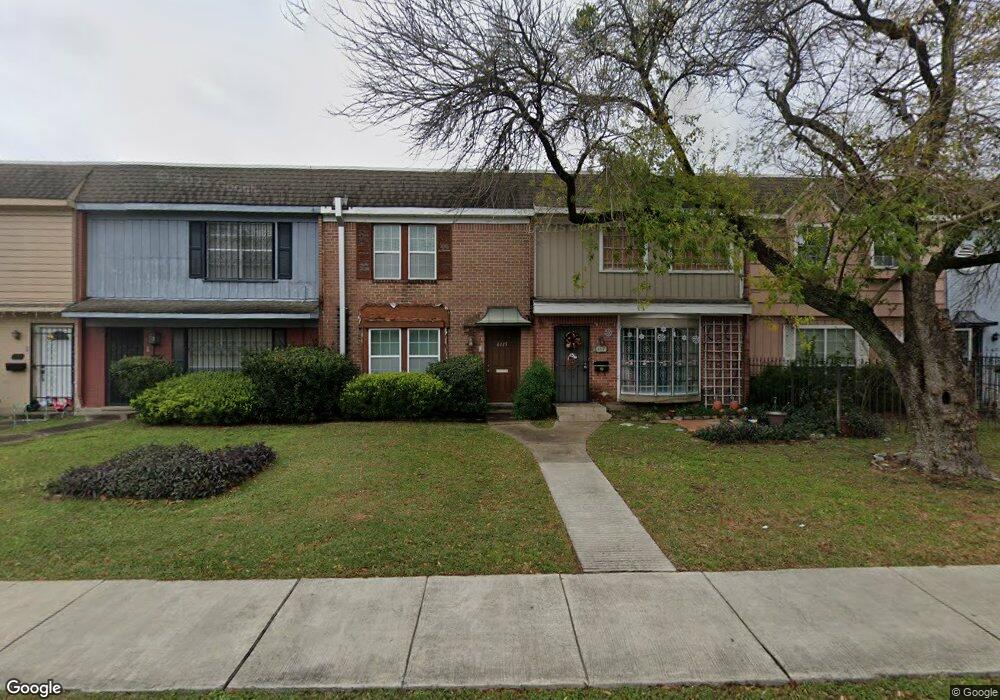
6111 Fondren Rd Unit 6111 Houston, TX 77036
Sharpstown NeighborhoodEstimated Value: $117,196 - $130,000
2
Beds
2
Baths
1,452
Sq Ft
$85/Sq Ft
Est. Value
About This Home
This home is located at 6111 Fondren Rd Unit 6111, Houston, TX 77036 and is currently estimated at $123,799, approximately $85 per square foot. 6111 Fondren Rd Unit 6111 is a home located in Harris County with nearby schools including Neff Elementary School, Sugar Grove Academy, and Sharpstown High School.
Ownership History
Date
Name
Owned For
Owner Type
Purchase Details
Closed on
Feb 29, 2024
Sold by
Huynh Robert Thieu
Bought by
Hernandez Franci Karina Monto
Current Estimated Value
Home Financials for this Owner
Home Financials are based on the most recent Mortgage that was taken out on this home.
Original Mortgage
$100,000
Outstanding Balance
$88,905
Interest Rate
6.69%
Mortgage Type
Seller Take Back
Estimated Equity
$34,894
Purchase Details
Closed on
Jul 17, 2021
Sold by
Ha Terry Thanh
Bought by
Huynh Robert Thieu
Purchase Details
Closed on
Oct 21, 2004
Sold by
Pscheidt Victoria Lynn Elizabeth
Bought by
Ha David S
Home Financials for this Owner
Home Financials are based on the most recent Mortgage that was taken out on this home.
Original Mortgage
$49,500
Interest Rate
5.73%
Mortgage Type
Purchase Money Mortgage
Create a Home Valuation Report for This Property
The Home Valuation Report is an in-depth analysis detailing your home's value as well as a comparison with similar homes in the area
Home Values in the Area
Average Home Value in this Area
Purchase History
| Date | Buyer | Sale Price | Title Company |
|---|---|---|---|
| Hernandez Franci Karina Monto | -- | Capital Title | |
| Huynh Robert Thieu | -- | None Listed On Document | |
| Huynh Robert Thieu | -- | None Listed On Document | |
| Ha David S | -- | Fidelity National Title |
Source: Public Records
Mortgage History
| Date | Status | Borrower | Loan Amount |
|---|---|---|---|
| Open | Hernandez Franci Karina Monto | $100,000 | |
| Previous Owner | Ha David S | $49,500 |
Source: Public Records
Tax History Compared to Growth
Tax History
| Year | Tax Paid | Tax Assessment Tax Assessment Total Assessment is a certain percentage of the fair market value that is determined by local assessors to be the total taxable value of land and additions on the property. | Land | Improvement |
|---|---|---|---|---|
| 2025 | $1,980 | $82,835 | $15,739 | $67,096 |
| 2024 | $1,980 | $94,607 | $17,975 | $76,632 |
| 2023 | $1,980 | $94,607 | $17,975 | $76,632 |
| 2022 | $2,083 | $94,607 | $17,975 | $76,632 |
| 2021 | $2,010 | $86,258 | $16,389 | $69,869 |
| 2020 | $2,158 | $86,258 | $16,389 | $69,869 |
| 2019 | $2,252 | $86,258 | $16,389 | $69,869 |
| 2018 | $2,009 | $79,411 | $15,088 | $64,323 |
| 2017 | $2,071 | $79,411 | $15,088 | $64,323 |
| 2016 | $1,558 | $59,718 | $11,346 | $48,372 |
| 2015 | $1,535 | $59,718 | $11,346 | $48,372 |
| 2014 | $1,535 | $59,718 | $11,346 | $48,372 |
Source: Public Records
Map
Nearby Homes
- 7655 Bellerive Dr Unit 3
- 6103 Fondren Rd Unit 7
- 6403 Fondren Rd Unit D25
- 7807 Bellerive Dr
- 7520 Hornwood Dr
- 7520 Hornwood Dr Unit 1204
- 7520 Hornwood Dr Unit 205
- 7520 Hornwood Dr Unit 1003
- 7520 Hornwood Dr Unit 906
- 7802 Gulfton St
- 7510 Hornwood Dr Unit 1606
- 7510 Hornwood Dr Unit 1207
- 7510 Hornwood Dr Unit 505
- 7510 Hornwood Dr Unit 201
- 8223 Golf Green Cir
- 6000 Reims Rd Unit 3009
- 6000 Reims Rd Unit 3207
- 6000 Reims Rd Unit 3105
- 6000 Reims Rd Unit 2202
- 6000 Reims Rd Unit 4108
- 7655 Bellerive Dr Unit 1655
- 6209 Fondren Rd Unit 6209
- 6115 Fondren Rd Unit 6115
- 6201 Fondren Rd Unit 6201
- 7659 Bellerive Dr Unit 7659
- 7657 Bellerive Dr Unit 7657
- 7653 Bellerive Dr Unit 7653
- 7651 Bellerive Dr Unit 7651
- 6109 Fondren Rd Unit 15
- 6109 Fondren Rd Unit 10
- 6201 Fondren Rd Unit 20
- 6111 Fondren Rd Unit 11
- 7657 Bellerive Dr Unit 4
- 7651 Bellerive Dr Unit 1
- 6107 Fondren Rd Unit 6107
- 6117 Fondren Rd Unit 6117
- 6113 Fondren Rd Unit 6113
- 6119 Fondren Rd Unit 6119
- 6119 Fondren Rd Unit 15
- 6121 Fondren Rd Unit 6121