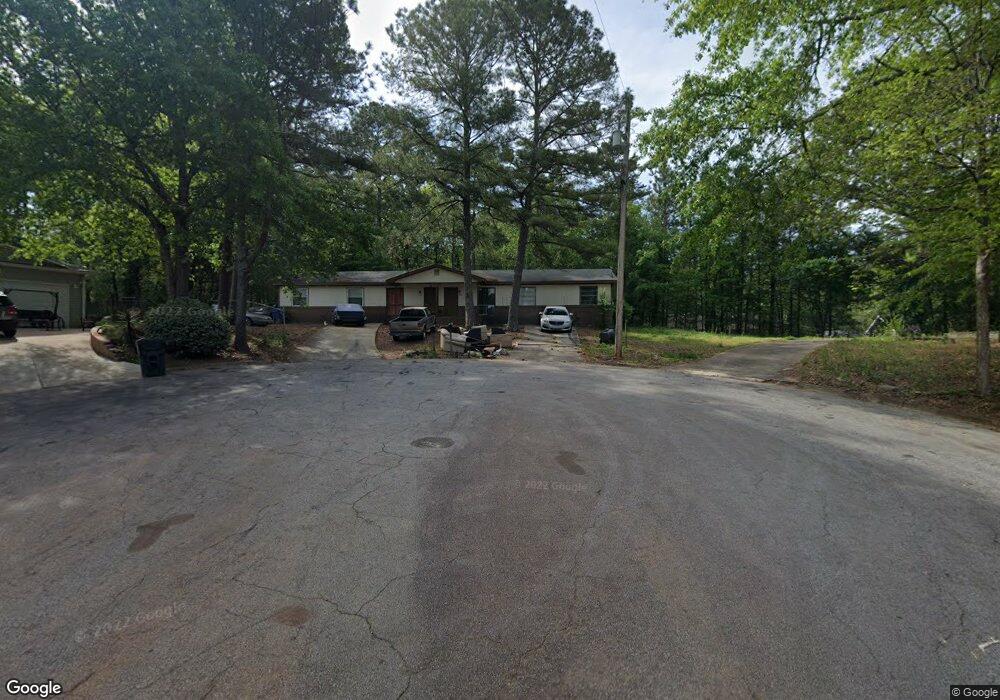
6111 Pineglen Cir SW Covington, GA 30014
Estimated Value: $187,609 - $230,000
--
Bed
2
Baths
1,975
Sq Ft
$110/Sq Ft
Est. Value
About This Home
This home is located at 6111 Pineglen Cir SW, Covington, GA 30014 and is currently estimated at $216,902, approximately $109 per square foot. 6111 Pineglen Cir SW is a home located in Newton County with nearby schools including Middle Ridge Elementary School, Clements Middle School, and Eastside High School.
Ownership History
Date
Name
Owned For
Owner Type
Purchase Details
Closed on
Apr 28, 2023
Sold by
Landa Properties Llc
Bought by
Landa App Llc and 6113 Pine Glen Circle Sw Covington Ga Ll
Current Estimated Value
Home Financials for this Owner
Home Financials are based on the most recent Mortgage that was taken out on this home.
Original Mortgage
$181,250
Interest Rate
6.32%
Mortgage Type
Mortgage Modification
Purchase Details
Closed on
Dec 18, 2020
Sold by
Lunsford House Properties Llc
Bought by
Ronald Blake Llc
Purchase Details
Closed on
Jan 10, 2018
Sold by
Lhp Investments Inc
Bought by
Lunsford House Properties Llc
Purchase Details
Closed on
Sep 13, 2017
Sold by
Not Provided
Bought by
Lhp Investments Inc
Purchase Details
Closed on
Jan 31, 2017
Sold by
Not Provided
Bought by
Bp Investments Ga Llc
Purchase Details
Closed on
Jan 2, 2015
Sold by
Herbert Howard B
Bought by
Spillers Realty Inc
Create a Home Valuation Report for This Property
The Home Valuation Report is an in-depth analysis detailing your home's value as well as a comparison with similar homes in the area
Home Values in the Area
Average Home Value in this Area
Purchase History
| Date | Buyer | Sale Price | Title Company |
|---|---|---|---|
| Landa App Llc | -- | -- | |
| Ronald Blake Llc | -- | -- | |
| Lunsford House Properties Llc | -- | -- | |
| Lhp Investments Inc | $410,000 | -- | |
| Bp Investments Ga Llc | $310,000 | -- | |
| Southern State Investments Llc | -- | -- | |
| Spillers Realty Inc | -- | -- |
Source: Public Records
Mortgage History
| Date | Status | Borrower | Loan Amount |
|---|---|---|---|
| Closed | Landa App Llc | $181,250 |
Source: Public Records
Tax History Compared to Growth
Tax History
| Year | Tax Paid | Tax Assessment Tax Assessment Total Assessment is a certain percentage of the fair market value that is determined by local assessors to be the total taxable value of land and additions on the property. | Land | Improvement |
|---|---|---|---|---|
| 2024 | $2,155 | $71,360 | $12,800 | $58,560 |
| 2023 | $1,975 | $60,760 | $5,000 | $55,760 |
| 2022 | $1,648 | $50,720 | $5,000 | $45,720 |
| 2021 | $904 | $24,880 | $5,000 | $19,880 |
| 2020 | $866 | $21,720 | $5,000 | $16,720 |
| 2019 | $792 | $19,480 | $3,600 | $15,880 |
| 2018 | $385 | $18,760 | $3,600 | $15,160 |
| 2017 | $505 | $12,280 | $2,400 | $9,880 |
| 2016 | $505 | $12,280 | $2,400 | $9,880 |
| 2015 | $522 | $12,680 | $2,400 | $10,280 |
| 2014 | $497 | $12,080 | $0 | $0 |
Source: Public Records
Map
Nearby Homes
- 6250 Green Acres Dr SW
- 6186 Green Acres Dr SW Unit 1
- 6154 Green Acres Dr SW
- 7133 Pineview Dr SW
- 7131 Pineneedle Dr SW
- 7120 Chaney Dr SW
- 7155 Petty St SW
- 0 Petty St Unit 10547316
- 0 Petty St Unit 7640177
- 7127 Greenway Cove SW
- 0.35 ACRES Kirk St SW
- 00 Kirk St SW
- 6191 Indian Creek Cir SW
- LOT 105 Puckett St SW
- 9176 Carr Cir SW
- 6111 Old Monticello St SE
- 9200 Jefferson Ave SW
- 9160 Puckett St SW
- 9186 Puckett St SW
- 7714 Saffron Ave
- 6105 Pineglen Cir SW
- 6100 Greenleaf Ct SW
- 6112 Pineglen Cir SW
- 6106 Green Leaf Ct SW
- 6108 Greenleaf Ct SW Unit 1
- 6106 Pineglen Cir SW
- 6110 Oakwood Cir SW
- 6239 Green Acres Dr SW
- 6116 Greenleaf Ct SW
- 6105 Green Leaf Ct SW Unit A&B
- 6105 Green Leaf Ct SW
- 6105 Greenleaf Ct SW
- 6105 Greenleaf Ct SW Unit A&B
- 6247 Green Acres Dr SW
- 6218 Green Acres Dr SW
- 6218 Green Acres Dr SW
- 6218 Green Acres Dr SW
- 6226 Green Acres Dr SW
- 6210 Green Acres Dr SW
- 6234 Green Acres Dr SW