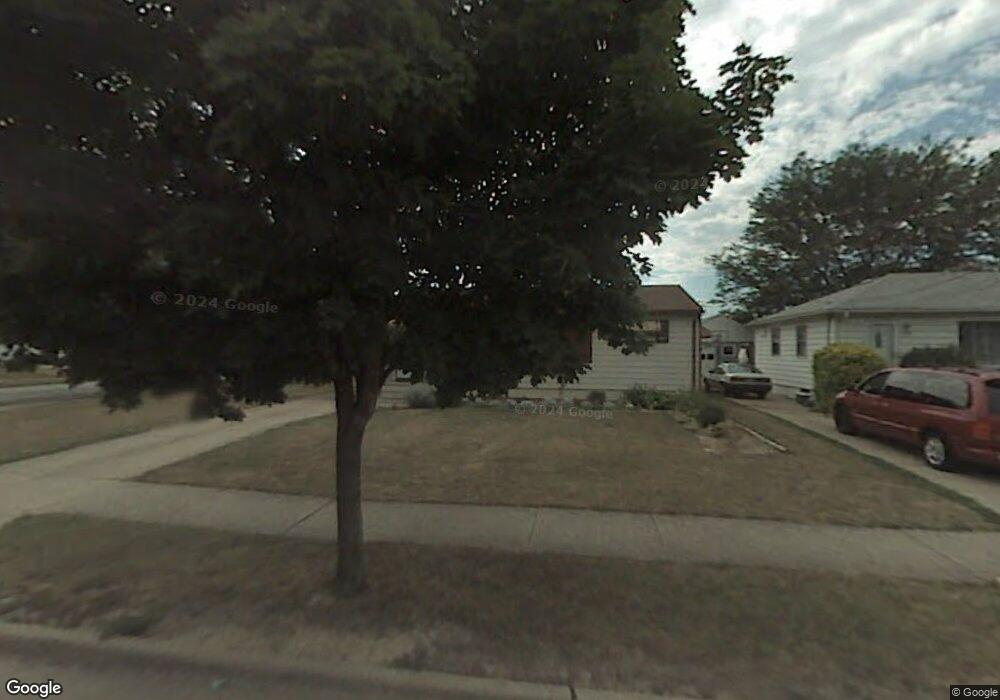
6112 Pickway Dr Brookpark, OH 44142
Estimated Value: $198,618 - $221,000
3
Beds
1
Bath
912
Sq Ft
$227/Sq Ft
Est. Value
About This Home
This home is located at 6112 Pickway Dr, Brookpark, OH 44142 and is currently estimated at $207,405, approximately $227 per square foot. 6112 Pickway Dr is a home located in Cuyahoga County with nearby schools including Berea-Midpark Middle School, Berea-Midpark High School, and Huber Heights Preparatory Academy Parma Academy.
Ownership History
Date
Name
Owned For
Owner Type
Purchase Details
Closed on
Jun 1, 2005
Sold by
Sykora Emil J and Sykora Linda L
Bought by
Fratus Deborah M
Current Estimated Value
Home Financials for this Owner
Home Financials are based on the most recent Mortgage that was taken out on this home.
Original Mortgage
$98,400
Interest Rate
5.43%
Mortgage Type
Fannie Mae Freddie Mac
Purchase Details
Closed on
Dec 7, 1999
Sold by
Sykora Emil J
Bought by
Sykora Emil J and Tomsic June
Purchase Details
Closed on
May 25, 1999
Sold by
Sykora Marie
Bought by
Tomsic June and Sykora Emil J
Purchase Details
Closed on
Apr 28, 1992
Sold by
Sykora Emil
Bought by
Sykora Marie
Purchase Details
Closed on
Oct 20, 1983
Sold by
Sykora Emil and Sykora Marie
Bought by
Sykora Emil
Purchase Details
Closed on
Jan 1, 1975
Bought by
Sykora Emil and Sykora Marie
Create a Home Valuation Report for This Property
The Home Valuation Report is an in-depth analysis detailing your home's value as well as a comparison with similar homes in the area
Home Values in the Area
Average Home Value in this Area
Purchase History
| Date | Buyer | Sale Price | Title Company |
|---|---|---|---|
| Fratus Deborah M | $123,000 | Galaxy Title | |
| Sykora Emil J | -- | -- | |
| Tomsic June | -- | -- | |
| Sykora Marie | -- | -- | |
| Sykora Emil | -- | -- | |
| Sykora Emil | -- | -- |
Source: Public Records
Mortgage History
| Date | Status | Borrower | Loan Amount |
|---|---|---|---|
| Closed | Fratus Deborah M | $98,400 | |
| Closed | Fratus Deborah M | $24,600 |
Source: Public Records
Tax History Compared to Growth
Tax History
| Year | Tax Paid | Tax Assessment Tax Assessment Total Assessment is a certain percentage of the fair market value that is determined by local assessors to be the total taxable value of land and additions on the property. | Land | Improvement |
|---|---|---|---|---|
| 2024 | $2,710 | $53,725 | $13,055 | $40,670 |
| 2023 | $2,753 | $45,190 | $10,010 | $35,180 |
| 2022 | $2,733 | $129,100 | $28,600 | $100,500 |
| 2021 | $2,717 | $45,190 | $10,010 | $35,180 |
| 2020 | $2,451 | $35,880 | $7,950 | $27,930 |
| 2019 | $2,378 | $102,500 | $22,700 | $79,800 |
| 2018 | $2,368 | $35,880 | $7,950 | $27,930 |
| 2017 | $2,331 | $32,620 | $7,490 | $25,130 |
| 2016 | $2,312 | $32,620 | $7,490 | $25,130 |
| 2015 | $2,169 | $32,620 | $7,490 | $25,130 |
| 2014 | $2,169 | $32,620 | $7,490 | $25,130 |
Source: Public Records
Map
Nearby Homes
- 6195 Hardin Dr
- 14890 Holland Rd
- 14344 Fayette Blvd
- 14417 Parkman Blvd
- 15450 Holland Rd
- 14055 Donald Dr
- 5677 Gateway Ln Unit E504
- 15800 Holland Rd
- 6378 Edgehurst Dr
- 6363 Lockhaven Dr
- 16051 Holland Rd
- 13971 Park Dr
- 16310 Richard Dr
- 6470 Sandfield Dr
- 13879 Zaremba Dr
- 15446 Sheldon Rd
- 14340 Kingman Dr
- 13765 Newton Rd
- 5348 W 147th St
- 6054 Langer Dr
- 6106 Pickway Dr
- 6100 Pickway Dr
- 6113 Mercer Dr
- 6107 Mercer Dr
- 14831 Sylvia Dr
- 6094 Pickway Dr
- 6101 Mercer Dr
- 14811 Sylvia Dr
- 6113 Pickway Dr
- 14851 Sylvia Dr
- 6107 Pickway Dr
- 14791 Sylvia Dr
- 6095 Mercer Dr
- 14871 Sylvia Dr
- 6101 Pickway Dr
- 6088 Pickway Dr
- 14771 Sylvia Dr
- 6095 Pickway Dr
- 6089 Mercer Dr
- 14893 Sylvia Dr