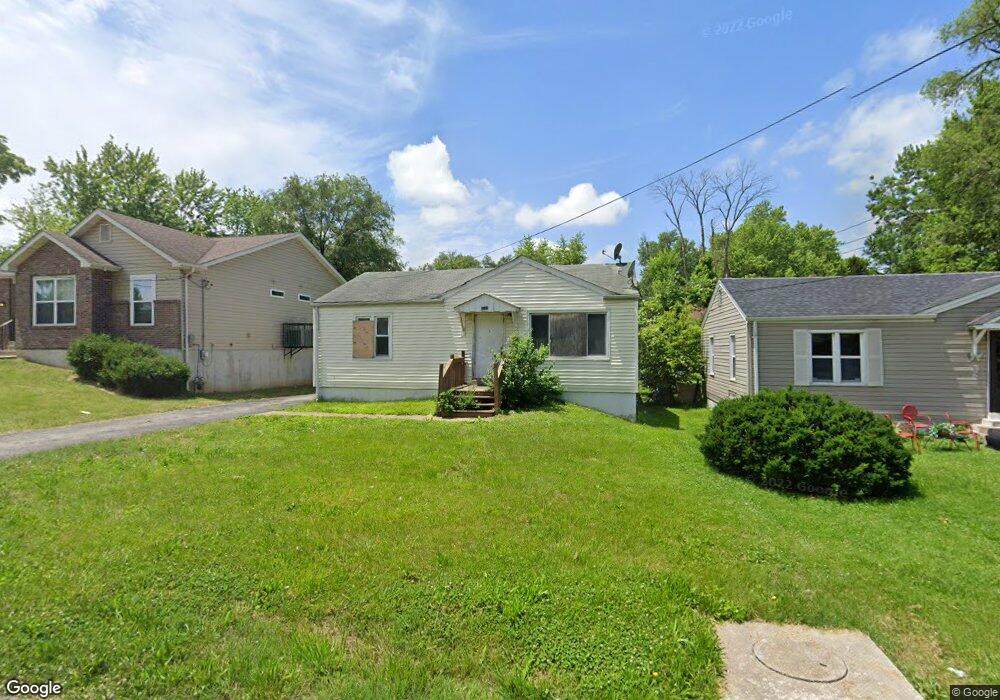
6113 Washington Ave Berkeley, MO 63134
Estimated Value: $61,000 - $99,000
2
Beds
1
Bath
816
Sq Ft
$98/Sq Ft
Est. Value
About This Home
This home is located at 6113 Washington Ave, Berkeley, MO 63134 and is currently estimated at $79,667, approximately $97 per square foot. 6113 Washington Ave is a home located in St. Louis County with nearby schools including Berkeley Elementary School, STEAM Academy at McCluer South-Berkeley High School, and Blessed Teresa of Calcutta Catholic School.
Ownership History
Date
Name
Owned For
Owner Type
Purchase Details
Closed on
Dec 19, 2025
Sold by
Access It Properties Llc
Bought by
Axiscore Holdings Mo Llc
Current Estimated Value
Home Financials for this Owner
Home Financials are based on the most recent Mortgage that was taken out on this home.
Original Mortgage
$68,800
Outstanding Balance
$68,668
Interest Rate
6.22%
Mortgage Type
New Conventional
Estimated Equity
$10,999
Purchase Details
Closed on
Dec 14, 2023
Sold by
White Pebble Holdings
Bought by
Access It Properties Llc
Home Financials for this Owner
Home Financials are based on the most recent Mortgage that was taken out on this home.
Original Mortgage
$336,000
Interest Rate
7.76%
Mortgage Type
New Conventional
Purchase Details
Closed on
Jun 9, 2023
Sold by
White Pebble Holdings Llc
Bought by
White Pebble Holdings Llc
Home Financials for this Owner
Home Financials are based on the most recent Mortgage that was taken out on this home.
Original Mortgage
$500,000
Interest Rate
6.39%
Mortgage Type
New Conventional
Purchase Details
Closed on
Jan 26, 2022
Sold by
Collector Of Revenue St Louis County Mis
Bought by
White Pebble Holdings
Create a Home Valuation Report for This Property
The Home Valuation Report is an in-depth analysis detailing your home's value as well as a comparison with similar homes in the area
Home Values in the Area
Average Home Value in this Area
Purchase History
| Date | Buyer | Sale Price | Title Company |
|---|---|---|---|
| Axiscore Holdings Mo Llc | -- | None Listed On Document | |
| Access It Properties Llc | -- | None Listed On Document | |
| White Pebble Holdings Llc | -- | Investors Title Company | |
| White Pebble Holdings | $5,210 | None Listed On Document |
Source: Public Records
Mortgage History
| Date | Status | Borrower | Loan Amount |
|---|---|---|---|
| Open | Axiscore Holdings Mo Llc | $68,800 | |
| Previous Owner | Access It Properties Llc | $336,000 | |
| Previous Owner | White Pebble Holdings Llc | $500,000 |
Source: Public Records
Tax History
| Year | Tax Paid | Tax Assessment Tax Assessment Total Assessment is a certain percentage of the fair market value that is determined by local assessors to be the total taxable value of land and additions on the property. | Land | Improvement |
|---|---|---|---|---|
| 2025 | $835 | $12,160 | $1,540 | $10,620 |
| 2024 | $835 | $10,740 | $1,160 | $9,580 |
| 2023 | $825 | $10,740 | $1,160 | $9,580 |
| 2022 | $649 | $7,320 | $1,160 | $6,160 |
| 2021 | $645 | $7,320 | $1,160 | $6,160 |
| 2020 | $671 | $7,110 | $1,160 | $5,950 |
| 2019 | $644 | $7,110 | $1,160 | $5,950 |
| 2018 | $728 | $7,300 | $1,180 | $6,120 |
| 2017 | $724 | $7,300 | $1,180 | $6,120 |
| 2016 | $702 | $6,820 | $1,180 | $5,640 |
| 2015 | $682 | $6,820 | $1,180 | $5,640 |
| 2014 | $821 | $8,250 | $1,690 | $6,560 |
Source: Public Records
Map
Nearby Homes
- 6148 Washington Ave
- 6042 Hancock Ave
- 8234 Airport Rd
- 6219 Tyndall Dr
- 6237 Garfield Ave
- 6006 Cascade Dr
- 8115 Myrick St
- 8219 Davenport Dr
- 8140 Packard Ave
- 6135 Shillington Dr
- 6005 Shillington Dr
- 8239 Cadillac Ln
- 309 Newell Dr
- 8406 January Ave
- 8301 Pepperidge Dr
- 222 Henquin Dr
- 308 Henquin Dr
- 324 Henquin Dr
- 825 Walters Dr
- 6621 Dunwold Dr
- 6117 Washington Ave
- 6105 Washington Ave
- 6121 Washington Ave
- 6110 Jackson Ave
- 6114 Jackson Ave
- 6125 Washington Ave
- 6122 Washington Ave
- 6116 Washington Ave
- 6118 Jackson Ave
- 6106 Jackson Ave
- 6110 Washington Ave
- 6124 Washington Ave
- 6102 Jackson Ave
- 6106 Washington Ave
- 6122 Jackson Ave
- 6059 Washington Ave
- 6129 Washington Ave
- 6113 Jefferson Ave
- 6128 Washington Ave
- 6117 Jefferson Ave
Your Personal Tour Guide
Ask me questions while you tour the home.