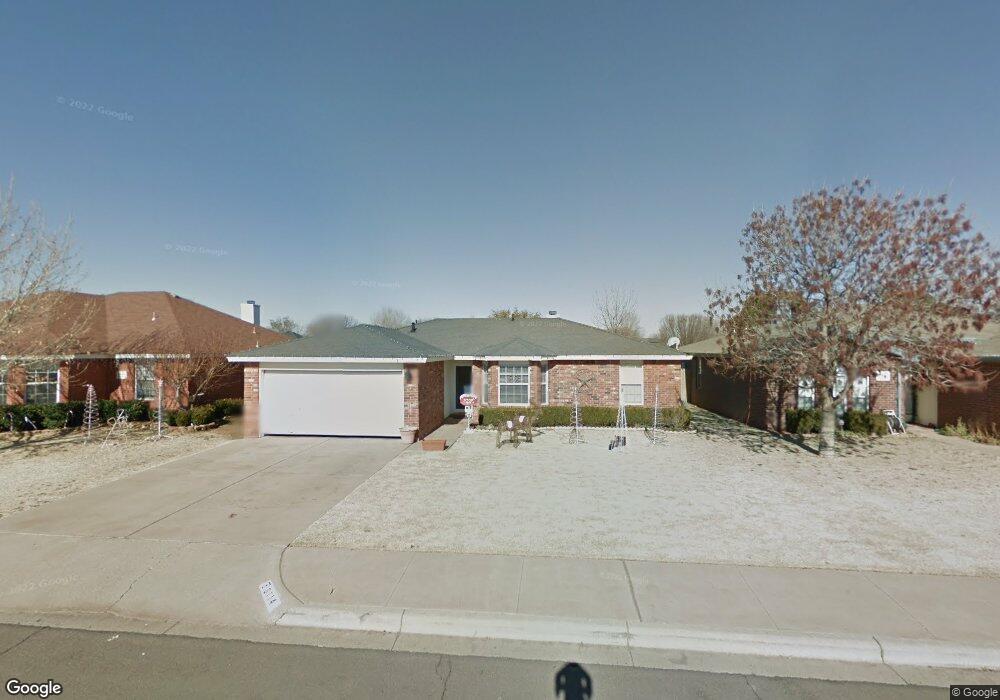
6114 7th St Lubbock, TX 79416
Northridge NeighborhoodEstimated Value: $169,778 - $177,000
3
Beds
2
Baths
1,302
Sq Ft
$133/Sq Ft
Est. Value
About This Home
This home is located at 6114 7th St, Lubbock, TX 79416 and is currently estimated at $173,445, approximately $133 per square foot. 6114 7th St is a home located in Lubbock County with nearby schools including North Ridge Elementary School, Terra Vista Middle School, and Frenship High School.
Ownership History
Date
Name
Owned For
Owner Type
Purchase Details
Closed on
Sep 6, 2018
Sold by
Dry Brandon
Bought by
Dbr Lending Group Llc
Current Estimated Value
Purchase Details
Closed on
Apr 30, 2015
Sold by
Bell Meadows Robert R and Bell Meadows Jennifer
Bought by
Dry Brandon
Home Financials for this Owner
Home Financials are based on the most recent Mortgage that was taken out on this home.
Original Mortgage
$91,200
Interest Rate
3.73%
Mortgage Type
Future Advance Clause Open End Mortgage
Purchase Details
Closed on
Nov 22, 2005
Sold by
Cox Andrew W and Cox Susan
Bought by
Dry Brandon
Purchase Details
Closed on
Feb 20, 2002
Sold by
Janway Stephen K
Bought by
Dry Brandon
Create a Home Valuation Report for This Property
The Home Valuation Report is an in-depth analysis detailing your home's value as well as a comparison with similar homes in the area
Home Values in the Area
Average Home Value in this Area
Purchase History
| Date | Buyer | Sale Price | Title Company |
|---|---|---|---|
| Dbr Lending Group Llc | -- | True Title | |
| Dry Brandon | $91,200 | Title One | |
| Dry Brandon | -- | -- | |
| Dry Brandon | -- | -- |
Source: Public Records
Mortgage History
| Date | Status | Borrower | Loan Amount |
|---|---|---|---|
| Previous Owner | Dry Brandon | $91,200 |
Source: Public Records
Tax History
| Year | Tax Paid | Tax Assessment Tax Assessment Total Assessment is a certain percentage of the fair market value that is determined by local assessors to be the total taxable value of land and additions on the property. | Land | Improvement |
|---|---|---|---|---|
| 2025 | $3,297 | $159,110 | $18,000 | $141,110 |
| 2024 | $33 | $159,702 | $18,000 | $141,702 |
| 2023 | $3,270 | $156,164 | $18,000 | $138,164 |
| 2022 | $3,168 | $139,165 | $18,000 | $121,165 |
| 2021 | $2,879 | $119,069 | $18,000 | $101,069 |
| 2020 | $2,821 | $116,099 | $18,000 | $98,099 |
| 2019 | $2,768 | $110,732 | $18,000 | $92,732 |
| 2018 | $2,982 | $119,128 | $18,000 | $101,128 |
| 2017 | $2,888 | $115,245 | $18,000 | $97,245 |
| 2016 | $2,751 | $109,803 | $9,600 | $100,203 |
| 2015 | $2,230 | $104,670 | $9,600 | $95,070 |
| 2014 | $2,230 | $97,989 | $9,600 | $88,389 |
Source: Public Records
Map
Nearby Homes
Your Personal Tour Guide
Ask me questions while you tour the home.