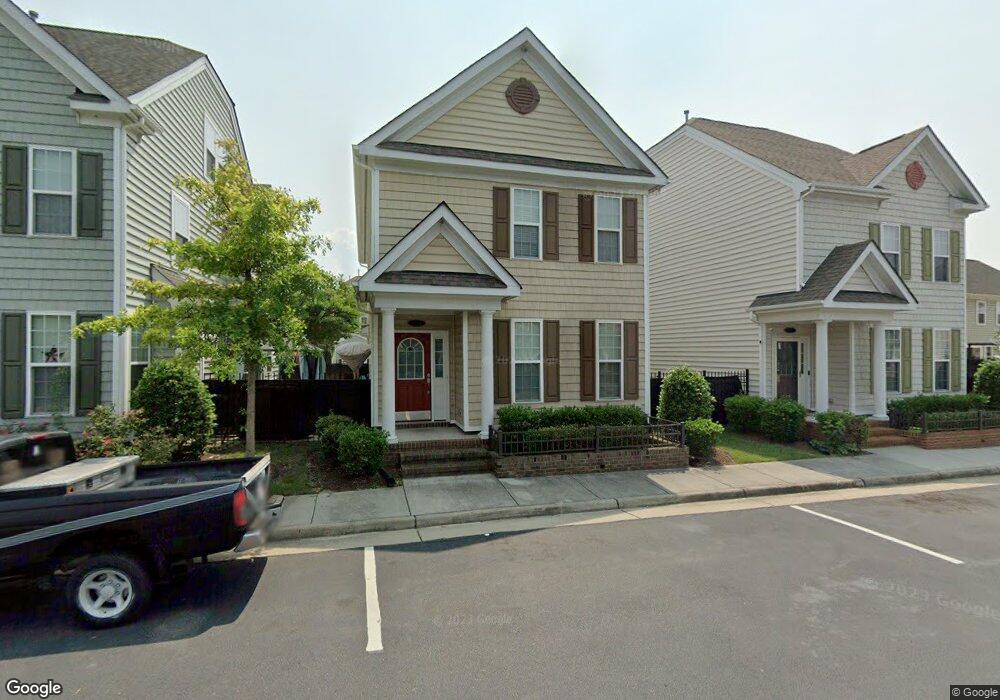
6114 Cushing St Unit 140 Suffolk, VA 23435
Nansemond NeighborhoodEstimated Value: $296,000 - $304,000
3
Beds
3
Baths
1,323
Sq Ft
$227/Sq Ft
Est. Value
About This Home
This home is located at 6114 Cushing St Unit 140, Suffolk, VA 23435 and is currently estimated at $299,804, approximately $226 per square foot. 6114 Cushing St Unit 140 is a home located in Suffolk City with nearby schools including Creekside Elementary School, John Yeates Middle School, and Nansemond River High School.
Ownership History
Date
Name
Owned For
Owner Type
Purchase Details
Closed on
Oct 18, 2017
Sold by
The Secretary Of Veterans Affairs An Off
Bought by
Mashura Matthew and Mashura Nury
Current Estimated Value
Home Financials for this Owner
Home Financials are based on the most recent Mortgage that was taken out on this home.
Original Mortgage
$165,482
Outstanding Balance
$137,336
Interest Rate
3.85%
Mortgage Type
New Conventional
Estimated Equity
$162,468
Purchase Details
Closed on
Jun 5, 2017
Sold by
Surety Trustees Llc A Virginia Limited L and Watson Israel T
Bought by
Secretary Of Veterans Affairs An Officer
Purchase Details
Closed on
Mar 24, 2014
Sold by
Terry Peterson Residential
Bought by
Watson Israel
Home Financials for this Owner
Home Financials are based on the most recent Mortgage that was taken out on this home.
Original Mortgage
$199,740
Interest Rate
4.25%
Mortgage Type
VA
Create a Home Valuation Report for This Property
The Home Valuation Report is an in-depth analysis detailing your home's value as well as a comparison with similar homes in the area
Home Values in the Area
Average Home Value in this Area
Purchase History
| Date | Buyer | Sale Price | Title Company |
|---|---|---|---|
| Mashura Matthew | $170,600 | Lytle Title & Escrow Llc | |
| Secretary Of Veterans Affairs An Officer | $159,695 | None Available | |
| Watson Israel | $199,740 | -- |
Source: Public Records
Mortgage History
| Date | Status | Borrower | Loan Amount |
|---|---|---|---|
| Open | Mashura Matthew | $165,482 | |
| Previous Owner | Watson Israel | $199,740 |
Source: Public Records
Tax History
| Year | Tax Paid | Tax Assessment Tax Assessment Total Assessment is a certain percentage of the fair market value that is determined by local assessors to be the total taxable value of land and additions on the property. | Land | Improvement |
|---|---|---|---|---|
| 2025 | $3,786 | $282,100 | $70,000 | $212,100 |
| 2024 | $3,786 | $270,300 | $55,000 | $215,300 |
| 2023 | $3,631 | $262,400 | $55,000 | $207,400 |
| 2022 | $3,160 | $237,600 | $50,000 | $187,600 |
| 2021 | $2,873 | $212,800 | $40,000 | $172,800 |
| 2020 | $2,761 | $204,500 | $40,000 | $164,500 |
| 2019 | $2,626 | $194,500 | $40,000 | $154,500 |
| 2018 | $2,641 | $195,900 | $40,000 | $155,900 |
| 2017 | $2,566 | $195,900 | $40,000 | $155,900 |
| 2016 | $2,638 | $195,900 | $40,000 | $155,900 |
| 2015 | -- | $195,900 | $40,000 | $155,900 |
| 2014 | -- | $195,900 | $40,000 | $155,900 |
Source: Public Records
Map
Nearby Homes
- 2231 Humphreys Dr
- 3705 Bamboo Rd
- 3715 Magnolia Dr
- 6302 Amberly Ct
- 3841 Old Farm Rd
- 6812 Burbage Lake Cir
- 6218 Oakglen Dr
- 5132 Duxbury Rd
- 3791 Towne Point Rd
- 6349 Old Townpoint Rd
- 3809 Peachtree Ln W
- 6354 Old Townpoint Rd
- 2018 Ashworth Way
- 2002 Ashworth Way
- 6336 Old Townpoint Rd
- 6205 Glenrose Dr
- 4628 Helensburgh Dr
- 1008 Ashworth Way
- 6404 Pelican Crescent N
- 1018 Ashworth Way
- 6114 Cushing St
- 6116 Cushing St Unit 141
- 6116 Cushing St
- 6112 Cushing St Unit 139
- 6112 Cushing St
- 6118 Cushing St Unit 142
- 6118 Cushing St
- 6120 Cushing St Unit 143
- 6120 Cushing St
- 5111 Moreland St Unit 146
- 5111 Moreland St Unit 146
- 5111 Moreland St
- 5109 Moreland St Unit 145
- 5109 Moreland St Unit 145
- 5109 Moreland St
- 5107 Moreland St Unit 144
- 5107 Moreland St
- 6113 Cushing St Unit 133
- 6113 Cushing St
- 6115 Cushing St Unit 134