Estimated Value: $895,000 - $995,000
Studio
--
Bath
1,656
Sq Ft
$571/Sq Ft
Est. Value
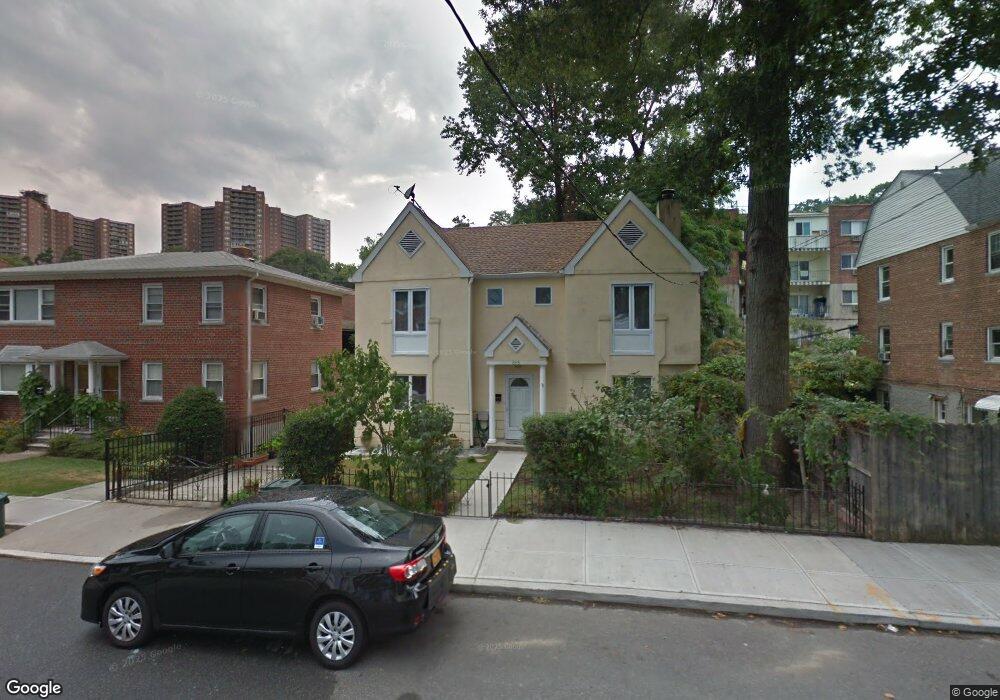
About This Home
This home is located at 6115 Delafield Ave, Bronx, NY 10471 and is currently estimated at $945,729, approximately $571 per square foot. 6115 Delafield Ave is a home located in Bronx County with nearby schools including P.S. 81 - Robert J. Christen, Riverdale Kingsbridge Academy, and St Margaret Of Cortona School.
Ownership History
Date
Name
Owned For
Owner Type
Purchase Details
Closed on
Jan 23, 2009
Sold by
Lotsvin Liliya
Bought by
Lotsvin Gregory and Lotsvin Ilya
Current Estimated Value
Purchase Details
Closed on
Jun 25, 1999
Sold by
Gaujean Max and Fleck Elaine Marie
Bought by
Lotsvin Liliya
Home Financials for this Owner
Home Financials are based on the most recent Mortgage that was taken out on this home.
Original Mortgage
$254,000
Interest Rate
8.19%
Purchase Details
Closed on
May 26, 1995
Sold by
Dolan Teresa
Bought by
Fleck Elaine and Gaujean Max
Home Financials for this Owner
Home Financials are based on the most recent Mortgage that was taken out on this home.
Original Mortgage
$238,000
Interest Rate
7.8%
Create a Home Valuation Report for This Property
The Home Valuation Report is an in-depth analysis detailing your home's value as well as a comparison with similar homes in the area
Purchase History
| Date | Buyer | Sale Price | Title Company |
|---|---|---|---|
| Lotsvin Gregory | -- | -- | |
| Lotsvin Liliya | -- | -- | |
| Fleck Elaine | $280,000 | -- |
Source: Public Records
Mortgage History
| Date | Status | Borrower | Loan Amount |
|---|---|---|---|
| Previous Owner | Lotsvin Liliya | $254,000 | |
| Previous Owner | Fleck Elaine | $238,000 |
Source: Public Records
Tax History
| Year | Tax Paid | Tax Assessment Tax Assessment Total Assessment is a certain percentage of the fair market value that is determined by local assessors to be the total taxable value of land and additions on the property. | Land | Improvement |
|---|---|---|---|---|
| 2025 | $8,998 | $47,488 | $13,354 | $34,134 |
| 2024 | $8,998 | $44,800 | $13,804 | $30,996 |
| 2023 | $8,583 | $42,264 | $11,203 | $31,061 |
| 2022 | $8,437 | $58,200 | $16,620 | $41,580 |
| 2021 | $8,773 | $49,560 | $16,620 | $32,940 |
| 2020 | $8,376 | $45,060 | $16,620 | $28,440 |
| 2019 | $7,810 | $39,480 | $16,620 | $22,860 |
| 2018 | $7,180 | $35,220 | $16,620 | $18,600 |
| 2017 | $7,507 | $36,824 | $14,869 | $21,955 |
| 2016 | $6,945 | $34,740 | $16,620 | $18,120 |
| 2015 | $4,802 | $39,812 | $18,006 | $21,806 |
| 2014 | $4,802 | $38,650 | $17,480 | $21,170 |
Source: Public Records
Map
Nearby Homes
- 6200 Riverdale Ave Unit 3K
- 6200 Riverdale Ave Unit 7J
- 6200 Riverdale Ave Unit 7A
- 6036 Liebig Ave
- 360 W 262nd St
- 6004 Netherland Ave
- 568-L W 261st St
- 351 W 262nd St
- 6126 Fieldston Rd
- 6300 Riverdale Ave Unit 5C
- 6300 Riverdale Ave Unit 6C
- 6300 Riverdale Ave Unit 1B
- 310 W 263rd St
- 5900 Arlington Ave Unit 15E
- 5900 Arlington Ave Unit 22P
- 5900 Arlington Ave Unit 8X
- 5900 Arlington Ave Unit 6S
- 6209 Spencer Terrace
- 5918 Delafield Ave
- 6015 Independence Ave
- 6111 Delafield Ave Unit 2
- 6111 Delafield Ave
- 6125 Delafield Ave
- 6125 Delafield Ave Unit 2
- 6125 Delafield Ave Unit 1
- 6129 Delafield Ave
- 6120 Riverdale Ave Unit 2
- 6120 Riverdale Ave Unit 1
- 6120 Riverdale Ave
- 451 W 261st St
- 6133 Delafield Ave Unit 2
- 6133 Delafield Ave Unit 1
- 6133 Delafield Ave
- 6122 Riverdale Ave
- 6118 Riverdale Ave
- 453 W 261st St
- 453 W 261st St Unit 2
- 6116 Delafield Ave Unit 2
- 6116 Delafield Ave
- 6118 Delafield Ave
Your Personal Tour Guide
Ask me questions while you tour the home.