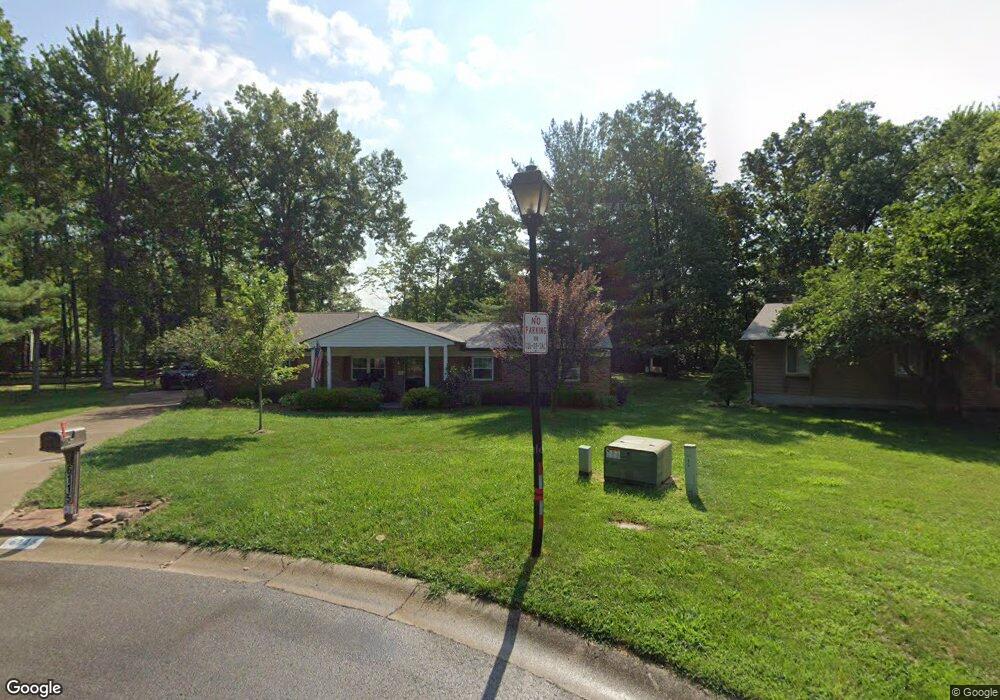
6115 Doe Ct Loveland, OH 45140
Outer Loveland NeighborhoodEstimated Value: $285,000 - $441,000
3
Beds
2
Baths
1,564
Sq Ft
$235/Sq Ft
Est. Value
About This Home
This home is located at 6115 Doe Ct, Loveland, OH 45140 and is currently estimated at $367,039, approximately $234 per square foot. 6115 Doe Ct is a home located in Clermont County with nearby schools including Milford Senior High School, Milford Christian Academy, and St. Andrew - St. Elizabeth Ann Seton School.
Ownership History
Date
Name
Owned For
Owner Type
Purchase Details
Closed on
Aug 20, 2002
Sold by
Kolodychak Daniel T
Bought by
Boyles Matthew R and Boyles Judith E
Current Estimated Value
Home Financials for this Owner
Home Financials are based on the most recent Mortgage that was taken out on this home.
Original Mortgage
$139,650
Outstanding Balance
$59,473
Interest Rate
6.64%
Mortgage Type
New Conventional
Estimated Equity
$307,566
Purchase Details
Closed on
Jun 9, 2000
Sold by
Bowles Timothy
Bought by
Kolodychak Daniel T and Kolodychak Margaret A
Home Financials for this Owner
Home Financials are based on the most recent Mortgage that was taken out on this home.
Original Mortgage
$75,000
Interest Rate
8.14%
Mortgage Type
New Conventional
Purchase Details
Closed on
Jun 1, 1987
Purchase Details
Closed on
Aug 1, 1986
Purchase Details
Closed on
Oct 1, 1985
Create a Home Valuation Report for This Property
The Home Valuation Report is an in-depth analysis detailing your home's value as well as a comparison with similar homes in the area
Home Values in the Area
Average Home Value in this Area
Purchase History
| Date | Buyer | Sale Price | Title Company |
|---|---|---|---|
| Boyles Matthew R | $147,000 | -- | |
| Kolodychak Daniel T | $138,000 | -- | |
| -- | $78,500 | -- | |
| -- | $74,000 | -- | |
| -- | $70,200 | -- |
Source: Public Records
Mortgage History
| Date | Status | Borrower | Loan Amount |
|---|---|---|---|
| Open | Boyles Matthew R | $139,650 | |
| Previous Owner | Kolodychak Daniel T | $75,000 |
Source: Public Records
Tax History Compared to Growth
Tax History
| Year | Tax Paid | Tax Assessment Tax Assessment Total Assessment is a certain percentage of the fair market value that is determined by local assessors to be the total taxable value of land and additions on the property. | Land | Improvement |
|---|---|---|---|---|
| 2024 | $4,056 | $97,450 | $19,430 | $78,020 |
| 2023 | $4,127 | $97,450 | $19,430 | $78,020 |
| 2022 | $3,980 | $73,710 | $14,700 | $59,010 |
| 2021 | $3,982 | $73,710 | $14,700 | $59,010 |
| 2020 | $3,818 | $73,710 | $14,700 | $59,010 |
| 2019 | $3,271 | $61,400 | $12,990 | $48,410 |
| 2018 | $3,272 | $61,400 | $12,990 | $48,410 |
| 2017 | $3,232 | $61,400 | $12,990 | $48,410 |
| 2016 | $3,032 | $52,920 | $11,200 | $41,720 |
| 2015 | $2,893 | $52,920 | $11,200 | $41,720 |
| 2014 | $2,769 | $52,920 | $11,200 | $41,720 |
| 2013 | $2,455 | $46,730 | $12,250 | $34,480 |
Source: Public Records
Map
Nearby Homes
- 6211 Spires Dr
- 6149 Century Farm Dr
- 1803 Wheatfield Way
- 2013 Weber Rd
- 6320 Ashford Dr
- 6141 Brandywine Ct
- 1064 Weber Rd
- 1140 Weber Rd
- 1124 Clover Field Dr
- 1113 Clover Field Dr
- 6077 Branch Hill Guinea Pike
- 6108 Donna Jay Dr
- 5933 Firm Stance Dr
- 6211 Cook Rd
- 1285 State Rte 28
- 1513 Charleston Ln
- 1376 Barre Ln
- 6395 Barre Rd
- 1289 Woodville Pike
- 6379 Derbyshire Ln
- 6117 Doe Ct
- 6113 Doe Ct
- 1127 Deerhaven Ct
- 1137 Deerhaven Ct
- 1139 Deerhaven Ct
- 6119 Doe Ct
- 1125 Deerhaven Ct
- 6122 Doe Ct
- 6124 Doe Ct
- 1123 Deerhaven Ct
- 6121 Doe Ct
- 1117 Deerhaven Ct
- 1136 Deerhaven Ct
- 6128 Doe Ct
- 1121 Deerhaven Ct
- 6123 Doe Ct
- 1111 Deerhaven Ct
- 1134 Deerhaven Ct
- 1143 Deerhaven Ct
- 1132 Deerhaven Ct