Estimated Value: $1,002,861 - $1,263,000
--
Bed
--
Bath
2,964
Sq Ft
$392/Sq Ft
Est. Value
About This Home
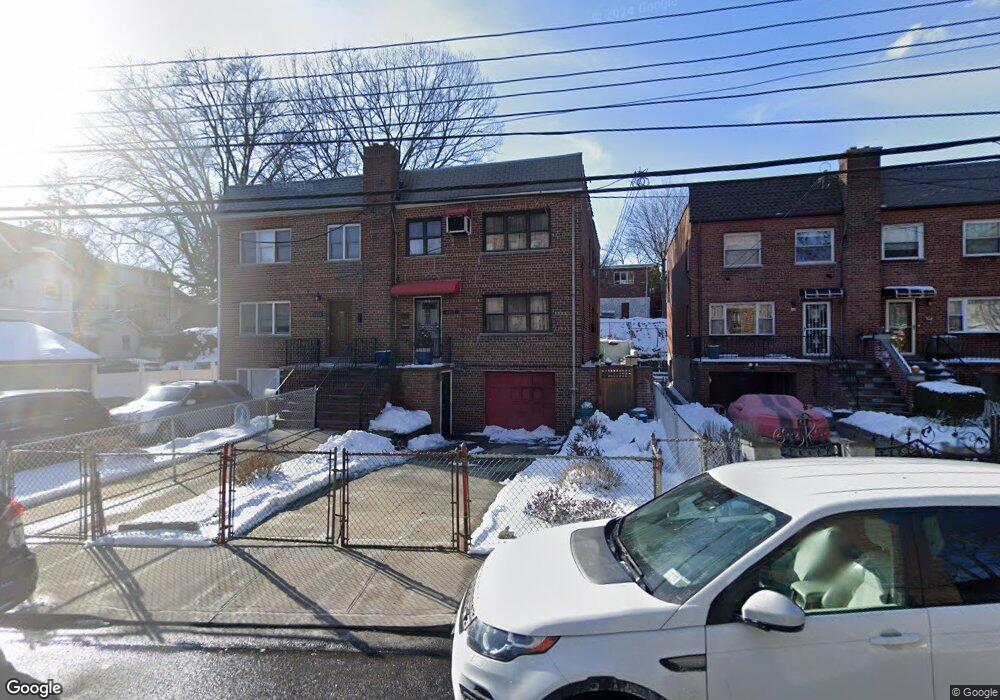
This home is located at 6117 Huxley Ave, Bronx, NY 10471 and is currently estimated at $1,163,215, approximately $392 per square foot. 6117 Huxley Ave is a home located in Bronx County with nearby schools including P.S. 81 - Robert J. Christen, Riverdale Kingsbridge Academy, and St Margaret Of Cortona School.
Ownership History
Date
Name
Owned For
Owner Type
Purchase Details
Closed on
Jun 16, 2021
Sold by
Calderon Esmeraldo A and Gamarra Marco Antonio
Bought by
Gamarra Marco Antonio and Gamarra Maria
Current Estimated Value
Home Financials for this Owner
Home Financials are based on the most recent Mortgage that was taken out on this home.
Original Mortgage
$380,000
Outstanding Balance
$344,364
Interest Rate
2.96%
Mortgage Type
Purchase Money Mortgage
Estimated Equity
$818,851
Purchase Details
Closed on
Jun 11, 2010
Sold by
Chee Chan Trust
Bought by
Calderon Esmeraldo A and Gamarra Marco Antonio
Home Financials for this Owner
Home Financials are based on the most recent Mortgage that was taken out on this home.
Original Mortgage
$448,717
Interest Rate
5.03%
Mortgage Type
Purchase Money Mortgage
Purchase Details
Closed on
Jun 15, 2005
Sold by
Chan Ho and Chan Lau Ho
Bought by
Boyle Ellen M
Create a Home Valuation Report for This Property
The Home Valuation Report is an in-depth analysis detailing your home's value as well as a comparison with similar homes in the area
Home Values in the Area
Average Home Value in this Area
Purchase History
| Date | Buyer | Sale Price | Title Company |
|---|---|---|---|
| Gamarra Marco Antonio | -- | -- | |
| Calderon Esmeraldo A | $600,000 | -- | |
| Boyle Ellen M | -- | -- |
Source: Public Records
Mortgage History
| Date | Status | Borrower | Loan Amount |
|---|---|---|---|
| Open | Gamarra Marco Antonio | $380,000 | |
| Closed | Calderon Esmeraldo A | $448,717 |
Source: Public Records
Tax History Compared to Growth
Tax History
| Year | Tax Paid | Tax Assessment Tax Assessment Total Assessment is a certain percentage of the fair market value that is determined by local assessors to be the total taxable value of land and additions on the property. | Land | Improvement |
|---|---|---|---|---|
| 2025 | $10,343 | $53,827 | $9,263 | $44,564 |
| 2024 | $10,343 | $51,494 | $9,522 | $41,972 |
| 2023 | $10,458 | $51,494 | $11,061 | $40,433 |
| 2022 | $10,061 | $55,020 | $12,360 | $42,660 |
| 2021 | $10,006 | $57,780 | $12,360 | $45,420 |
| 2020 | $9,495 | $55,920 | $12,360 | $43,560 |
| 2019 | $8,977 | $45,060 | $12,360 | $32,700 |
| 2018 | $8,748 | $42,912 | $10,267 | $32,645 |
| 2017 | $8,561 | $41,999 | $10,979 | $31,020 |
| 2016 | $7,921 | $39,622 | $11,985 | $27,637 |
| 2015 | $5,093 | $37,380 | $13,740 | $23,640 |
| 2014 | $5,093 | $35,760 | $13,740 | $22,020 |
Source: Public Records
Map
Nearby Homes
- 6112 Fieldston Rd
- 315 W 262nd St
- 6133 Fieldston Rd
- 351 W 262nd St
- 6033A Huxley Ave
- 227 W 260th St
- 143 Bruce Ave Unit 7A
- 6036 Liebig Ave
- 6140 Delafield Ave
- 204 W 260th St
- 5926 Spencer Ave
- 5930 Tyndall Ave
- 6141 Delafield Ave
- 6200 Riverdale Ave Unit 3K
- 305 W 259th St
- 6535 Broadway Unit 2G
- 6535 Broadway Unit 6
- 6535 Broadway Unit 2A
- 6535 Broadway Unit 2
- 6535 Broadway Unit 4J
- 6115 Huxley Ave
- 6119 Huxley Ave
- 251 W 261st St
- 251 W 261st St Unit 1
- 251 W 261st St Unit PH
- 6121 Huxley Ave
- 6103 Huxley Ave
- 6103 Huxley Ave Unit huxley
- 257 W 261st St
- 6120 Spencer Ave
- 6112 Spencer Ave
- 218 W 262nd St
- 261 W 261st St
- 6126 Spencer Ave
- 220 W 262nd St
- 265 W 261st St
- 249 W 261st St
- 210 W 262nd St Unit 3-H
- 210 W 262nd St Unit 2L
- 210 W 262nd St Unit 2C